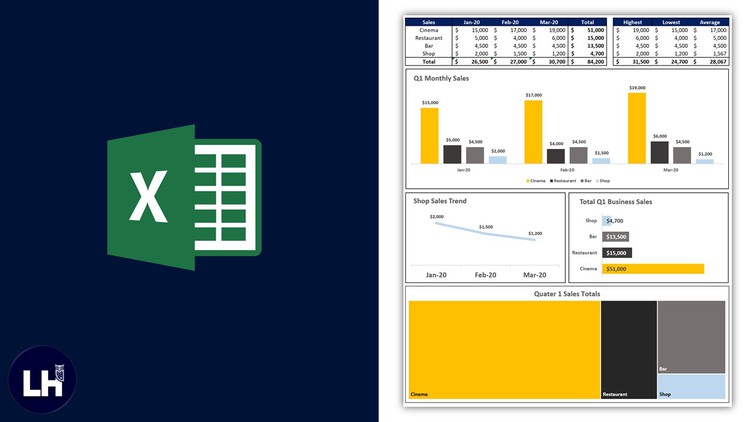
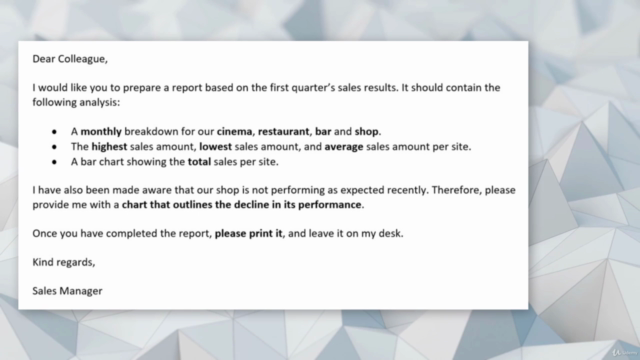
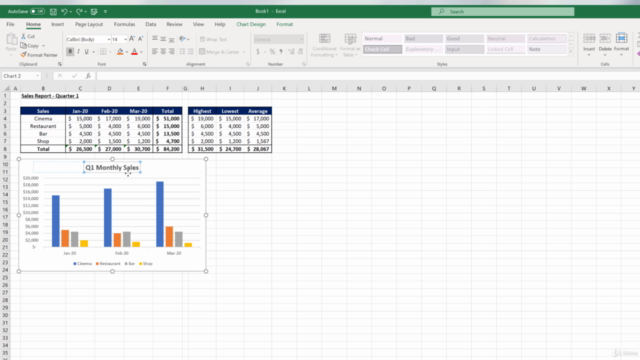
Microsoft Excel Basics - Creating a Sales Report

Why take this course?
Course Title: Microsoft Excel Basics - Creating a Sales Report
Course Headline: 🚀 Learn how to create a great looking sales report in under an hour in this project-based course! 📊
Unlock Your Excel Potential: Are you ready to master Microsoft Excel and turn data into gold? Whether you're a beginner or looking to sharpen your skills, this Microsoft Excel Basics - Creating a Sales Report course is your golden ticket! 🎫
Why Take This Course?
- Beginner Friendly: No prior knowledge of Excel required; we'll cover the basics first.
- Hands-On Approach: Learn by doing with real-world projects.
- Skill Progression: From fundamental to advanced, we've got you covered at every level.
- Practical Application: Gain skills that are directly applicable to your job and everyday tasks.
- Time Efficient: Achieve proficiency in creating compelling sales reports under an hour!
Course Breakdown:
-
Getting Comfortable with Excel: 🧭
- Navigating Excel like a pro
- Understanding data entry and basic functions
-
Data Manipulation Mastery:
- Filtering, sorting, and using Excel functions
- Introduction to formulas and functions to manipulate data
-
Visualizing Data with Charts & Graphs: 📈
- Creating, customizing, and formatting charts
- Using conditional formatting to highlight key sales data
-
Enhancing Your Report:
- Adding tables, images, and other elements to your report
- Applying advanced formatting techniques for a polished look
-
Finalizing the Sales Report: 🏆
- Integrating all elements into a cohesive sales report
- Reviewing best practices for reporting in Excel
What You'll Learn:
- How to navigate and understand the layout of Excel
- Basic to advanced functions, including IFERROR, VLOOKUP, and more
- Creating dynamic charts and graphs that tell a story
- Formatting your report for both readability and aesthetic appeal
- Presenting financial data in a way that's easy to understand
By the End of This Course, You Will:
- Be confident in creating your own sales reports
- Understand how to present data effectively within Excel
- Have practical experience in manipulating and visualizing data
- Feel empowered to use Excel as a powerful tool in your daily tasks
Enroll Now! 🎉 Don't let another day go by where data seems daunting. Enhance your career, impress your boss, and bring value to your team with the skills you'll gain from this comprehensive course on Microsoft Excel Basics - Creating a Sales Report. Let's make those numbers pop! 💼✨
Embark on Your Excel Journey Today! With expert guidance, practical exercises, and a focus on real-world application, you'll be crafting stunning sales reports in no time. 🚀 Join us now and turn data into impact! 📊
Course Gallery


Loading charts...