Microsoft 365 Power BI Report Builder

Why take this course?
🌟 Course Headline:
Master Data Visualization with Microsoft 365 Power BI Report Builder - Your First Step into Interactive Reporting!
Microsoft 365 Power BI Report Builder - Beginner Course Description:
🚀 Course Introduction: In today's data-driven world, the ability to transform complex datasets into insightful reports is a skill in high demand. With Microsoft 365 Power BI's Report Builder, you can create compelling interactive reports that are easily accessible across all devices. Whether you're part of a dynamic team or an organization looking to streamline report generation, this course is your gateway to mastering the basics of Power BI Report Builder.
🔍 What You'll Learn:
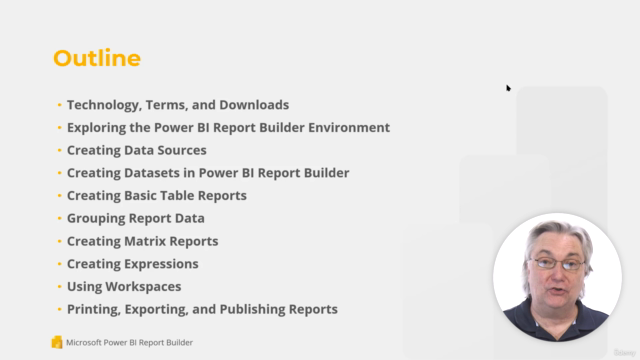
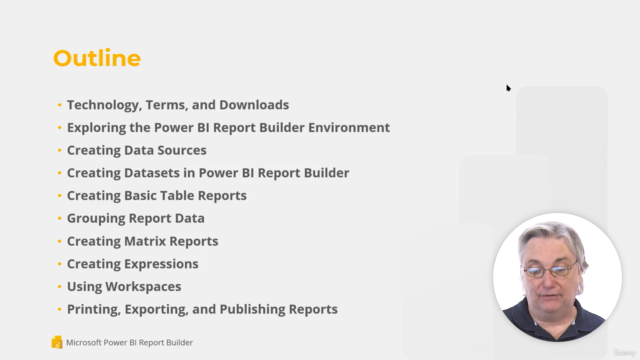
- Fundamentals of Power BI Report Builder: Dive into the core concepts and understand how Power BI fits into the broader Microsoft 365 ecosystem.
- Getting Started: Step-by-step guidance on downloading and setting up your Power BI Report Builder environment.
- Exploring Power BI Service: Familiarize yourself with the Power BI Service, where your reports will come to life.
- Creating Data Sources: Learn how to connect and create data sources from various origins, including the Power BI Service itself.
- Building Datasets: Understand the art of crafting datasets that serve as the backbone of your reports.
- Table Reports and Sorting/Grouping: Begin creating basic table reports and master the techniques to sort and group data for better insights.
- Advanced Tabular Reports (Matrices): Transition from simple tables to advanced tabular reports, akin to an Excel PivotTable.
- Working with Expressions: Get to grips with expressions, the powerful formulae that can manipulate data and provide complex calculations.
- Storing and Sharing Reports: Explore workspaces within Power BI Service as the storage units for your reports and learn how to share them with colleagues or clients.
- Publishing and Exporting Reports: Acquire the skills to finalize, publish, print, and export reports for various purposes and audiences.
📚 Course Features:
- Hands-On Learning: Engage with practical exercises that allow you to apply what you learn in real-time.
- Interactive Environment: Use the Report Builder's environment to explore and understand how each component contributes to your report.
- Real-World Applications: Examine completed reports to see the end product of your efforts.
- Comprehensive Guide: A step-by-step course that takes you from a beginner to someone capable of creating and publishing interactive reports.
- Accessible Learning: Access your learning materials anytime, anywhere on any device with an internet connection.
🎓 Why Take This Course? By completing this course, you will have the knowledge and skills to:
- Create compelling and interactive reports using Power BI Report Builder.
- Connect various data sources to your reports for a comprehensive view of your data.
- Share insights with your organization through published and accessible reports on the Power BI Service.
- Gain a foundation that will prepare you for more advanced reporting techniques in future courses.
🛠️ Who Is This Course For? This course is perfect for:
- Newcomers to Power BI Report Builder looking to enter the world of data visualization.
- Business analysts who need to create interactive reports and dashboards.
- Data professionals aiming to expand their skill set with Microsoft's Power BI suite.
- Anyone interested in learning how to turn data into actionable insights through reporting.
📆 Enroll Today! Embark on your journey to becoming a data visualization expert with this beginner's course in Microsoft 365 Power BI Report Builder. Enroll now and unlock the potential of your data! 🚀💻
Ready to transform data into stories that drive action? Join us and become proficient in creating interactive reports with Microsoft 365 Power BI Report Builder - your first step into a world of data-driven decision making. Let's visualize the future together! 🎉✨ #PowerBI #DataVisualization #ReportBuilding #LearnPowerBIRight #BeginnersWelcome
Course Gallery


Loading charts...