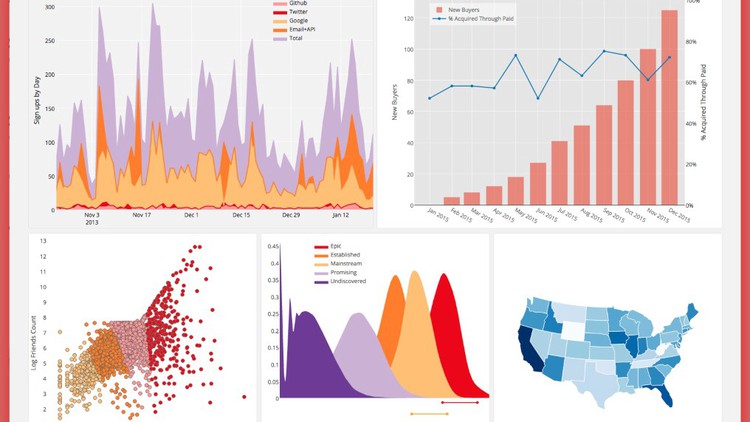
Data Visualization in Python Masterclass™ for Data Scientist

Why take this course?
🎉 Master Matplotlib for Data Visualization & Analysis with Python in Our 2021 Edition!
🚀 Course Title: Data Visualization in Python Masterclass™ for Data Scientists
🔍 Course Headline: Dive Deep into Matplotlib for Data Visualization and Analysis with Python – The Ultimate Guide!
Your Journey to Data Mastery Begins Here! 🌟
Welcome to the definitive course for mastering Matplotlib – the powerful Python library that's a staple in every data scientist's toolkit. In this comprehensive, hands-on tutorial, you'll learn by doing, crafting your way through the intricacies of Matplotlib to transform raw data into compelling visual stories.
Course Overview:
📚 Getting Started with Matplotlib: We begin with a gentle introduction to installing and integrating Matplotlib within your Python environment, setting the stage for what's to come.
🔍 Exploring 2D Charts: Understand the essence of data storytelling by creating and customizing essential 2D charts. You'll learn how to present your data clearly and effectively, making complex information accessible and understandable.
📈 Mastering Subplots: Discover the power of subplots and how they can be used to compare datasets or display additional relevant information alongside your main plot.
Interactive Visualizations:
- 🎯 Scatter Plots: Understand distributions and relationships between two variables.
- 🚀 Line Plots: Track changes over time and identify trends.
- 🏆 Bar Charts: Compare different groups easily.
- 📊 Stacked Bars: See the composition of your data at a glance.
- 🤹♂️ Histograms: Analyze the distribution of data with a focus on shape and spread.
- ♻️ Pie Charts: Visualize proportions within a whole.
Diving into 3D Plots: Take your visualizations to the next level by creating captivating 3D plots that add depth to your data storytelling.
Beyond the Basics:
- Learn how to plot images alongside your data for a more contextual analysis.
- Understand advanced techniques for creating more complex and interactive visualizations.
Why Choose This Course? 🏅
- 2021 Edition Content: Our course content is meticulously updated with the latest Matplotlib features and best practices.
- Hands-On Knowledge: We believe in learning by doing, so you'll get your hands dirty with practical exercises that solidify your understanding of Matplotlib.
- Expert Guidance & Support: Our team is dedicated to providing you with support throughout your learning journey. Have questions? We're here to help!
Ready to elevate your data visualization skills and become a master of Matplotlib with Python? Enroll now and embark on this transformative learning experience! 📊✨
By the end of this course, you'll be equipped to create an array of sophisticated plots that will not only make your data speak but also sing! So, what are you waiting for? Let's turn those numbers and datasets into compelling visual narratives with Python and Matplotlib! 🚀📊🎉
Loading charts...