Matplotlib for Data Visualization with Python 2022 Edition
Why take this course?
🌟 Course Title: Master Data Visualization with Matplotlib for Python 2022 Edition
📚 Course Headline: 📊 Turn your data into amazing data visualizations using Matplotlib in Python.
Are you ready to transform the way you interact with data? Dive into the world of Python and Matplotlib, where numbers and figures spring to life! 🐍🔮
Course Description:
The only path to mastery with Matplotlib for Data Visualization with Python is through direct experience. This course is your hands-on guide to harnessing the full potential of Matplotlib to create impactful and insightful visualizations. 🖥️✨
🚀 What You'll Learn:
-
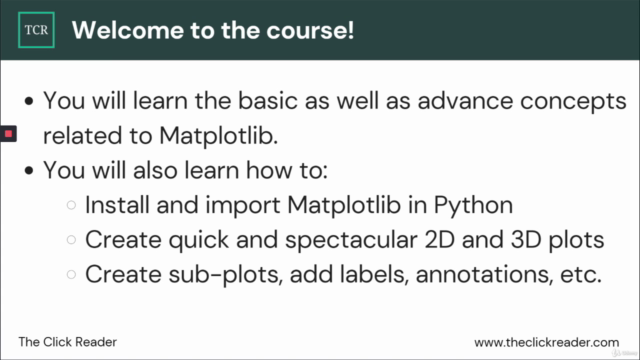
Introduction to Matplotlib: We kick off with a comprehensive walkthrough on how to install and import this powerful Python library, setting the stage for your data journey.
-
Basic 2D Charts: Discover how to create, customize, and enhance fundamental charts to effectively communicate your findings.
-
Subplots Magic: Unlock the secrets of subplots in Matplotlib and master the art of organizing multiple plots in a single display for a more comprehensive visual story.
-
Exploring Plots: Dive into an array of plot types, including Scatter, Line, Bar, Stacked Bar, Histograms, Pie Charts, and more. Each type offers unique insights that can be critical to your analysis.
-
3D Visualizations: Step into the third dimension with Matplotlib and learn how to add depth to your data visualizations for a truly multi-dimensional perspective. 🌟
-
Image Plotting: Integrate images within your plots to enrich your visual content and provide context that resonates with your audience.
Why You Should Take This Course?
✅ Updated Content (2022 Edition): The course is meticulously updated with the latest Matplotlib features, ensuring you're equipped with current best practices.
✅ Hands-On Knowledge: This isn’t a theory class—it’s a hands-on masterclass designed to give you the practical skills needed to create stunning visualizations.
✅ Guided Support: You don't have to navigate this journey alone. Our team is here to guide you with expert support and answer any questions along the way.
With Matplotlib for Data Visualization with Python, you're not just learning a tool; you're gaining a skill set that will elevate your data analysis to new heights. 🚀
🎓 Enroll now and take the first step towards becoming a data visualization maestro! Let Matplotlib be the brush in your hand as you paint a picture of data that speaks volumes.
Course Gallery
Loading charts...