Complete Python & Matplotlib Data Visualization

Why take this course?
🌐 Complete Python & Matplotlib Data Visualization Mastery
🚀 Course Headline: Dive into the world of data visualization with this comprehensive Udemy course on Python 3, Jupyter, NumPy, and Matplotlib. Perfect for beginners to advanced users, this course will empower you with the skills needed to create stunning visualizations that can set your career trajectory soaring!
📘 Course Description:
Become a Master in Data Visualization with Python 3 and acquire employers' one of the most requested skills of the 21st Century! A great data visualization engineer earns more than $150,000 per year! 💰
This is the most comprehensive, yet straight-forward course for Data Visualization with Python 3 on Udemy! Whether you have never worked with Data Visualization before, already know basics of Python, or want to delve into the advanced features of matplotlib and NumPy with Python 3, this course is tailored to meet your needs. In this course, we will teach you Data Visualization with Python 3, Jupyter, NumPy, and Matplotlib.
📚 Course Highlights:
- Over 85 lectures with more than 10 hours of content!
- Practical learning with every lecture accompanied by a full programming video and a corresponding Jupyter notebook with Python 3 code.
- Step-by-step guidance on setting up your environment – install Python 3 on Windows or Raspberry Pi and get familiar with the Python 3 ecosystem on Raspberry Pi.
- Comprehensive coverage of topics including:
- Basics of Scientific Python Ecosystem
- Digital Image Processing fundamentals
- NumPy and Matplotlib basics
- Jupyter installation and usage
- Mastery of Ndarrays, array creation routines, random array generation, bitwise operations, statistical functions, plotting, and more!
- Dive into various visualization types: bar, histograms, scatter, bubble plots, contours, and 3D visualizations (plot, mesh, and surfaces).
- Explore advanced concepts in Matplotlib.
- Delve into basic image processing with NumPy and Matplotlib.
🔍 What You'll Learn:
- The scientific Python ecosystem and how it can revolutionize your data handling.
- Image processing techniques using NumPy and Matplotlib.
- How to install, configure, and use Jupyter for your projects.
- To create a wide range of visualizations, from basic plots to complex 3D representations.
- Advanced concepts in matplotlib that will set your data visualizations apart.
🎓 Course Materials:
You will gain lifetime access to over 75 lectures plus corresponding PDFs, Image Datasets, and the Jupyter notebooks for the lectures! This comprehensive package ensures that you have everything you need to learn at your own pace and refer back to the materials as needed.
💼 Career Advancement:
By mastering Python 3 Data Visualization with this course, you will not only enhance your career prospects but also gain a wealth of knowledge that is highly sought after in the tech industry. Start learning today, and transform your data into captivating visual stories!
🔥 Why You Should Take This Course:
- Learn a skill set that is highly valued and can increase your marketability as a Python developer or data scientist.
- Engage with practical examples and hands-on projects to solidify your learning experience.
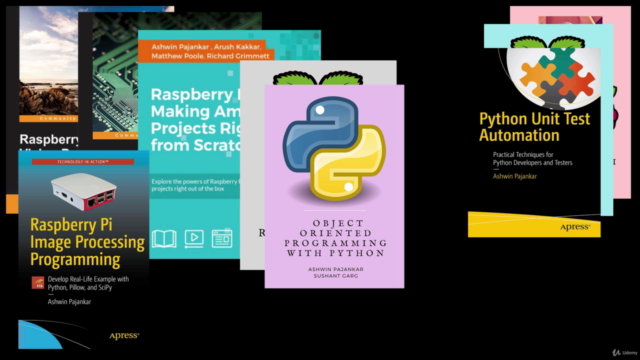
- Benefit from the expertise of an experienced instructor, Ashwin Pajankar, who has helped over 80,000 students worldwide to excel in Python and Data Visualization.
So what are you waiting for? Enroll now and embark on a journey to master Data Visualization with Python 3! 🚀📊💫
Course Gallery


Loading charts...