Python Matplotlib Crash Course in Hindi
Why take this course?
🚀 Matplotlib Course in Hindi: Live Coding with Practical Examples! 🌍 Welcome to Studyopedia's Matplotlib Koori 🎓
Are you ready to dive into the world of Data Visualization using Python? With Studyopedia's Matplotlib Course, we bring to you an interactive learning experience where you can witness live running coding examples alongside understanding complex concepts. 🧐✨
Matplotlib: An Overview 📊
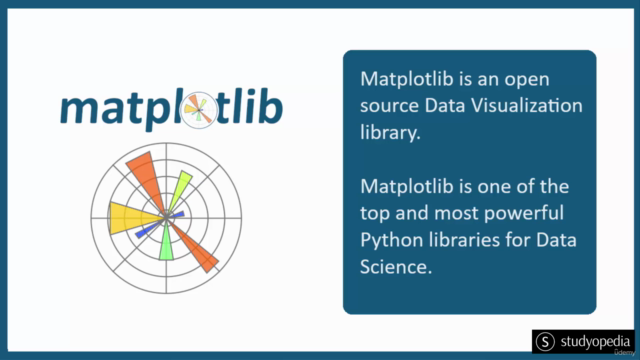
Matplotlib is a powerful plotting library for Python, created by John D. Hunter and used widely across scientific communities for data visualization. It was built on NumPy and stands as one of the top three libraries in Python for creating interactive and appealing graphs and plots. 🌟
Why Learn Matplotlib? 🚀
- Versatile: A complete open-source Python library, ideal for both static, dynamic, and interactive data visualizations.
- Ease of Data Handling: Easily import and plot your data with minimal hassle.
- Customization: Craft visually stunning plots using a vast array of styles, colors, and shapes.
- Export Options: Save your plots in various formats such as PNG, JPEG, or SVG.
- Third-Party Integration: Enhance your visualizations with additional features from third-party packages on top of Matplotlib.
Course Lessons: Master Matplotlib Step by Step! 🛠️
-
Matplotlib - Introduction
- Understand what Matplotlib is and why it's a must for data scientists.
-
Install & Setup Matplotlib
- Get Matplotlib up and running on your system.
-
Matplotlib PyPlot Submodule
- Execute your first Matplotlib program.
-
Matplotlib - Plotting
- Learn how to plot basic graphs with real data.
-
Add Grid Lines
- Make your plots more readable by adding grid lines.
-
Add Labels to a Plot
- Customize your plots with labels for axes and titles.
-
Plot Titles and Position them
- Master the art of positioning and designing plot titles.
-
Add a Legend in a Graph
- Easily include legends to differentiate data sets.
-
Position Legends
- Learn how to place legends effectively within your plots.
-
Change the background color of the Legend
- Customize your legend's look and feel.
-
Change the font size of the Legend
- Adjust text sizes for optimal readability.
12-16. Creating Different Types of Plots
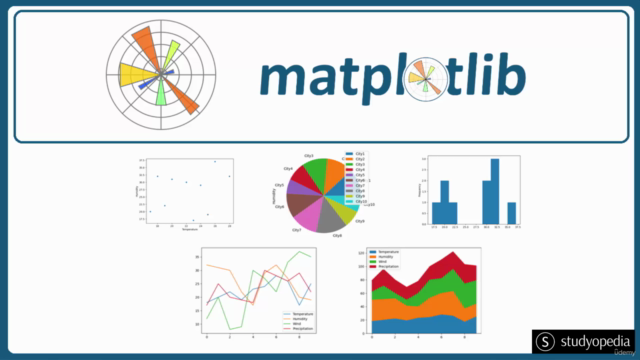
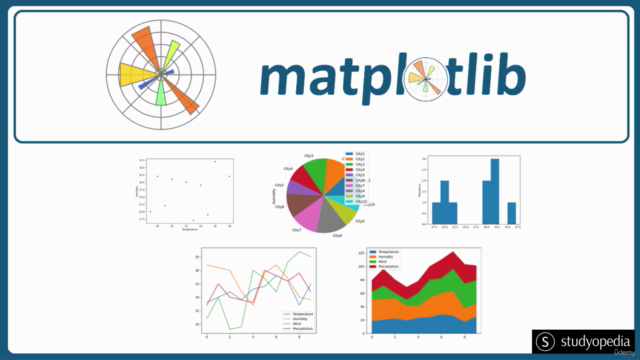
- Dive into various plot types: Bar Graph, Pie Chart, Line Graph, Histogram, and Scatter Plot.
🚀 Key Features of Matplotlib 🔍
- Open Source: Fully open-source and customizable for your unique needs.
- User-Friendly: Makes plotting simple and efficient.
- Rich Features: From basic plotting to complex visualizations, Matplotlib handles it all.
- Extensible: Easily extend its functionality with additional packages.
🎉 Embark on Your Data Visualization Journey with Studyopedia! 📈💫
Join us in this engaging course that combines live coding sessions with practical examples to ensure you not only learn but also understand how to effectively visualize data using Matplotlib. Enroll now and transform your Python skills into stunning, informative plots! 🌟🎓
Course Gallery
Loading charts...