Mastering data visualization in D3.js

Why take this course?
🚀 Welcome to Mastering Data Visualization in D3.js! 🚀
Are you ready to transform data into compelling stories? 📊✨ Then you're in the right place! This course is a deep dive into the world of data visualization with one of the most powerful libraries out there—D3.js (V6.x). By the end of this intensive introduction, you'll be crafting virtually any visualization you can dream up.
📐 Course Outline 📐
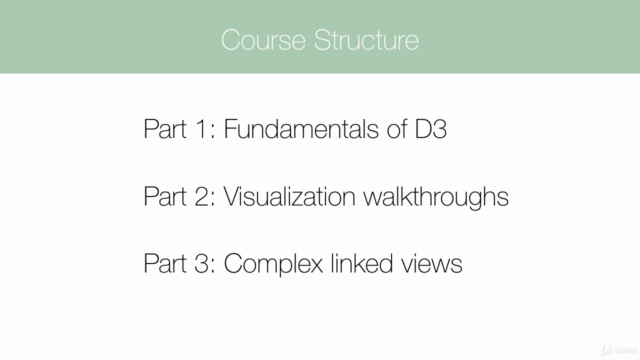
In the first phase of our journey, we'll build a solid foundation with D3 and cover some of the core concepts in data visualization:
- 🎨 Understand SVGs and their role with D3.
- 🔗 Learn how to associate shapes with data.
- ✅ Write scales, axes, and labels for basic visualizations.
- ✨ Utilize the D3 update pattern to dynamically position SVGs.
- 👤 Add user interactions with events.
- 🚀 Incorporate legends, tooltips, and sliders to enhance your visualizations.
We'll also delve into design principles for data visualization:
- Make informed decisions about your visualizations.
- Justify your choices effectively.
- Select the right visual channels for different datasets.
Moving on to the second phase, we'll embark on a crash course through 12 new visualizations with real-world examples from the D3 community:
- 📈 Master Line, Area, Stacked Area, and more chart types.
- 🌍 Explore geographical data with Choropleth Maps.
- 🤝 Understand Node-Link Diagrams and how they work.
- 🌳 Experiment with Tree Diagrams and Treemaps.
- ⚛️ Discover the intricacies of Circle Packs and Sunburst Plots.
In this phase, you'll learn how to:
- Find and adapt open source code for your projects.
- Combine visualizations for a multi-graph user experience.
- Use brushes in D3 to create interactive elements.
Class Projects 🛠️
To solidify your learning, the course includes 4 class projects:
- A simple bar chart showing revenue growth for a coffee chain.
- A cloned Gapminder bubble chart that users can interact with.
- An interactive line chart displaying historical cryptocurrency data.
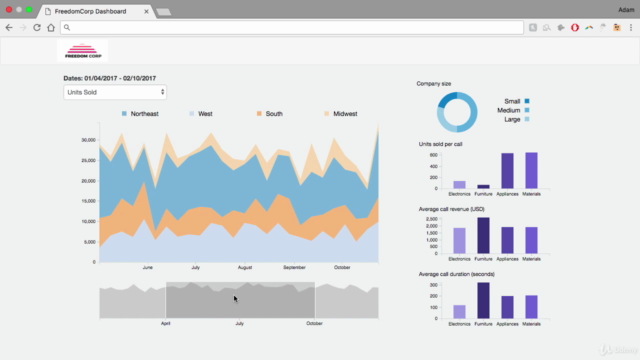
- A comprehensive data dashboard for a large conglomerate company.
These projects are designed to increase in complexity, ensuring you're ready for the challenges of real-world visualizations.
🎓 Who Should Take This Course? 🎓
This course is perfect for:
- Developers who have a good grasp of JavaScript, HTML, CSS, and jQuery.
- Anyone looking for a rigorous introduction to D3.js (V6).
- Data analysts or scientists who want to present their findings creatively.
- Designers aiming to add interactive data visualizations to their skillset.
This isn't an entry-level course, so prior experience with web development is crucial. If you meet these prerequisites and are eager to unlock the power of D3 to bring your data to life, this course is for you!
Join us on this exciting journey to master data visualization with D3.js. Let's turn numbers into narratives and make your data beautiful, meaningful, and impactful! 🌟✨
Course Gallery


Loading charts...
Comidoc Review
Our Verdict
Boasting 26k subscribers and 14 unique visualizations, this course effectively lays down foundational D3 practices. However, inconsistent audio quality, the use of outdated methods in latter modules, as well as a rushed pace, can sometimes mar learner experience. While the instructor provides solid examples to learn from, anticipate challenges with v6 integration and minor disruptions owing to occasional discrepancies in the course's overall timeline.\n\nWith room for improvement noted in keeping content updated and addressing technical nuances for a user-friendly environment, Mastering data visualization in D3.js still has the capacity to empower learners with its wide variety of well-explained graphics that follow current library standards.
What We Liked
- Covers fundamental building blocks of D3 with a wide breadth of knowledge
- 14 different visualizations taught; projects at the core of learning experience
- Instructor explains syntax and open-source code comprehensively
- Excellent course for covering basics, with fun examples and projects
Potential Drawbacks
- Content could benefit from updates in several areas, particularly to v6
- Outdated techniques can be hard to follow; more modern frameworks suggested
- Audio level and quality inconsistent, impacting learning experience
- Moves at a very fast pace; students may struggle to keep up and digest