Mastering Data Visualization with Python

Why take this course?
🌟 Mastering Data Visualization with Python 📊
Course Title: Mastering Data Visualization with Python
Course Instructor: Sandeep Kumar, Quality Gurus Inc.
Course Headline:
Unlock the power of data and transform raw numbers into compelling visual stories with our comprehensive online course! Learn to harness the full potential of pandas, matplotlib, and seaborn libraries for impactful data analysis and data science. 🎓🔬
Course Description:
Dive into the world of data visualization and learn to draw meaningful insights from your datasets. This course is meticulously designed to help you master the art of representing data visually with Python's most powerful libraries.
Key Takeaways:
-
Understand Data Visualization: Gain a solid grasp of why visualizing data is crucial for analysis and communication.
-
Learn Python Libraries: Master
pandas,matplotlib, andseabornto effectively visualize your data. -
Explore Various Graphs: Get hands-on experience with different types of graphs, including Line Plots, Bar Charts, Pie Charts, Histograms, Box-Whisker Plots, Scatter Plots, and more.
Module A: Pandas 🐘
-
Time-Series Analysis: Learn to plot Time-series data with a Line Plot.
-
Discrete Variable Representation: Understand how to visualize a Single Discrete Variable using Bar Plots and Pie Charts.
-
Continuous Variable Insights: Explore data distributions with Histograms, Density or KDE Plots, and Box-Whisker Plots.
-
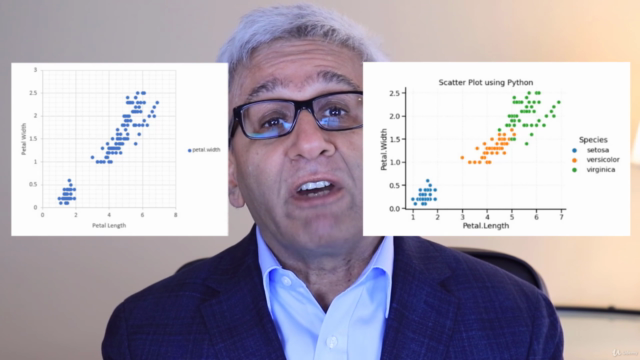
Two Variable Correlation: Analyze the relationship between two continuous variables with a Scatter Plot, and between one continuous and one discrete variable with a Box-Whisker Plot.
Module B: Matplotlib 📈
-
Time-Series Analysis: Enhance your Line Plots for time-series data.
-
Discrete Variable Representation: Craft Bar Plots and Pie Charts to represent discrete variables effectively.
-
Continuous Variable Insights: Utilize Histograms, Density or KDE Plots, and Box-Whisker Plots for continuous variable analysis.
-
Two Continuous Variable Analysis: Explore the relationships between two continuous variables with Scatter Plots.
-
Subplots Mastery: Learn to create subplots with multiple axes on a single figure for comprehensive data representation.
Module C: Seaborn 🎨
-
Relational Plotting: Use
relplotto create Scatter Plots and Line Plots that highlight relationships between variables. -
Distribution Analysis: Leverage
displotfor detailed Distribution Plots, including Histograms, KDE, ECDF, and Rug Plots. -
Categorical Data Exploration: Utilize
catplotwith Strip Plots, Swarm Plots, Box Plots, Violin Plots, Point Plots, and Bar plots to analyze categorical data. -
Specialty Plots: Get to know Joint Plots, Pair Plots, and Linear Model Plots for in-depth analysis.
Course Conclusion:
Wrap up your learning journey by customizing your visualizations with themes that suit your style, context, color palette, and font. Learn to make each graph tell a story that resonates with your audience. 🎨🔮
Embark on this transformative learning experience and become a maestro of data visualization with Python! Enroll now and transform your data into captivating visual narratives that inform, influence, and inspire.
Course Gallery


Loading charts...