Master D3.js with Concepts & 25+ Projects | ~43 Hours

Why take this course?
🎓 Master D3.js with Concepts & 25+ Projects | ~43 Hour Course
🚀 Headline: Beginner to Advanced | Learn D3.js in Depth and Create Interactive Data Visualizations
Unlock the Power of Data Visualization with D3.js!
This course is your comprehensive guide to mastering D3.js, a powerful JavaScript library for creating data visualizations in web browsers. No prior experience? No problem! This step-by-step journey begins with the fundamentals and progresses all the way to advanced applications, ensuring you build a solid understanding of D3.js from scratch.
What's Inside:
-
🎨 Understanding SVG: Dive into the world of Scalable Vector Graphics (SVG), the foundational technology that D3.js uses to render data visualizations in the browser.
-
🛠️ D3.js Basics: Get acquainted with the core concepts and principles of D3.js, learning how to manipulate SVG elements to bring your datasets to life.
-
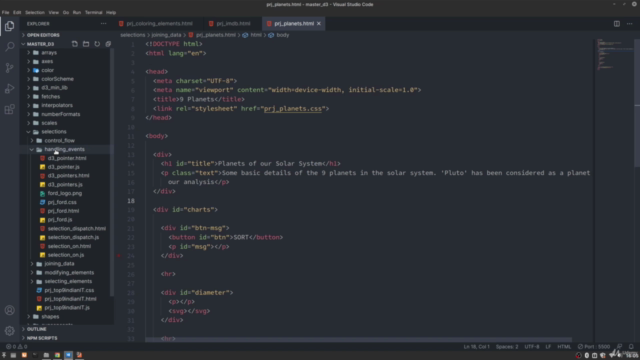
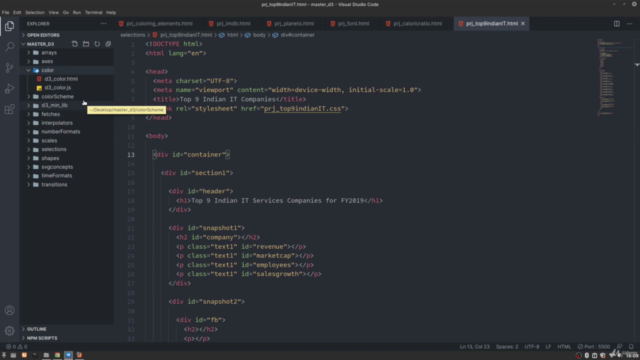
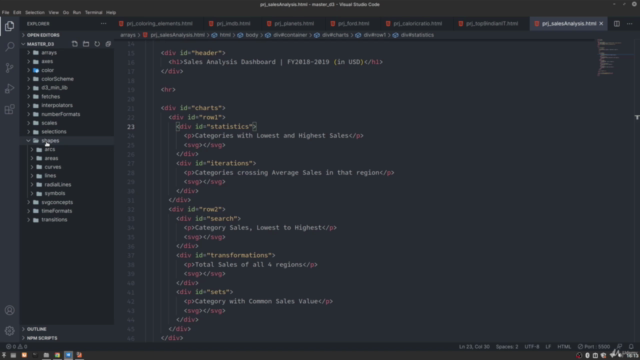
Systematic Learning: Engage with 12 important modules of D3.js, each broken down into digestible methods and techniques.
-
Hands-On Practice: With each module, you'll tackle real-world projects, solidifying your knowledge and enhancing your skill set. In many cases, you'll work on multiple projects per module to ensure a deep understanding of the material.
Key Course Highlights:
-
Detailed Explanations: Every method in the D3.js library is explained with clear code examples and demonstrated live in your browser console.
-
Practical Application: The course is designed so that you can immediately apply what you've learned through hands-on projects, ensuring that you not only understand the concepts but can also implement them effectively.
-
Advanced Skills: This course goes beyond just learning D3.js; it equips you with the ability to build complex, scalable applications in both your personal and professional endeavors.
What You'll Learn:
-
📊 Data Binding: Understand how to bind data to the DOM using D3.js.
-
🚀 Interactive Visualizations: Create interactive charts, graphs, and maps that respond to user input.
-
✨ Advanced Techniques: Explore advanced features like hierarchical data representations (dendrograms), geospatial visualization, and animations.
-
📈 Real-World Projects: Work on 25+ projects that cover a wide range of applications, from simple line charts to complex interactive visualizations.
By the end of this course, you will not only have a comprehensive understanding of D3.js but also a portfolio of 25+ projects showcasing your newfound expertise. Join us on this journey and transform the way you work with data! 📊💫
Enroll now and take the first step towards becoming an expert in data visualization with D3.js! 🚀🎉
Course Gallery
Loading charts...