How to manage your process using statistical Excel Tools

Why take this course?
🎉 Course Title: Master the Art of Data Analysis for Quality Assurance with Excel!
Unlock Your Potential as a Professional Data Analyst
Embark on a transformative journey with our online course, "How to Manage Your Process Using Statistical Excel Tools", and elevate your skill set in data analysis for quality assurance. This comprehensive course is designed for individuals who are keen on harnessing the power of Excel to streamline and enhance their process management capabilities.
Course Description:
In this dynamic course, you will dive into the intricacies of process mapping and yield calculation, gaining a deeper understanding of where rework and scrap occur. We'll start by exploring the Why behind analysis in process maps and the importance of yield calculations to optimize production processes.
-
Core Modules:
- Introduction to Excel for Quality Assurance
- Learn to use Excel for data analysis with provided PowerPoint slides and data sets.
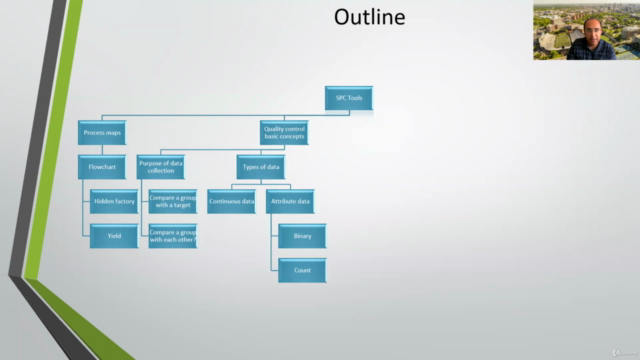
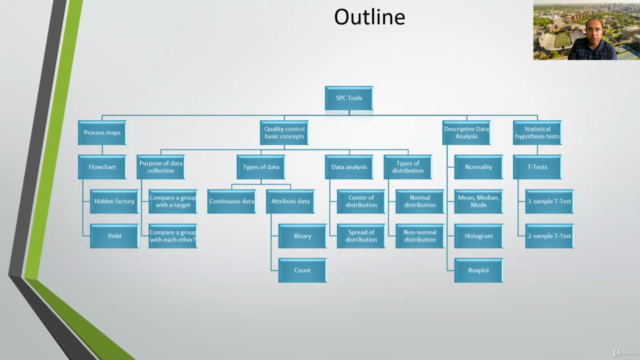
- Master the art of process mapping, including Flowcharts and identifying Hidden Factories.
- Understand Yield Calculations (IPY & RTY) to pinpoint areas for improvement.
- Introduction to Excel for Quality Assurance
-
Statistical Tools & Techniques:
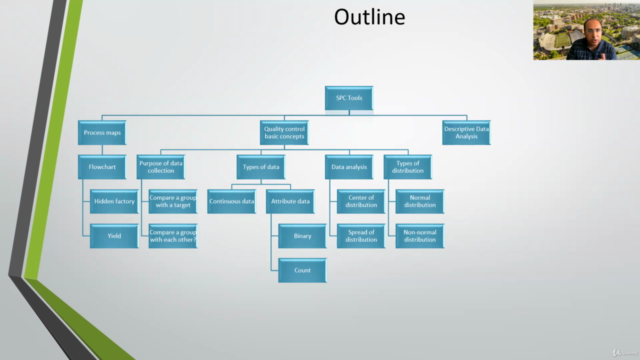
- Grasp the fundamentals of Statistical Process Control (SPC) Tools.
- Dive into Quality Control basics and the purpose of data collection.
- Identify the types of data, including Continuous, Attribute, Binary, and Count data.
-
Data Analysis Mastery:
- Analyze the center and spread of distributions to understand descriptive statistics.
- Explore different distribution types, such as Normal and Non-normal distributions.
- Learn Descriptive Data Analysis with a focus on Normality, Mean, Median, Mode, Histograms, and Boxplots.
-
Statistical Hypothesis Tests:
- Conduct T-Tests to compare sample means with population means in a 1-sample or 2-sample scenario.
- Utilize the Data Analysis ToolPak Excel add-on for hypothesis testing.
-
Visualize Data with Statistical Charts:
- Create I-MR and X-Bar charts to visualize statistical data.
- Learn how to use formulas or templates in Excel for creating various types of process charts.
Why Choose This Course?
✅ Practical Hands-on Learning: Engage with real-world scenarios and practice with provided datasets.
✅ Expert Guidance: Learn from an expert instructor, Aizad Adam Ahmad, who brings years of industry experience to the course.
✅ Real-World Applications: Apply your knowledge directly to process management in any field.
✅ Comprehensive Materials: Receive PowerPoint slides and Excel data sets for a complete learning experience.
🚀 Transform Your Career: Become a professional data analyst with the skills needed to manage quality assurance processes effectively.
What You Will Learn:
- Process Mapping: Map out business processes to identify areas of potential inefficiency.
- Yield Calculation: Understand IPY & RTY calculations to optimize production yields.
- Statistical Concepts: Grasp basic statistical concepts and apply them using Excel.
- Data Analysis Techniques: Learn how to analyze data to make informed decisions.
- Quality Control Basics: Gain insights into the purpose of data collection in quality assurance.
- Hypothesis Testing: Perform T-Tests to compare different groups and assess if sample means are significantly different from population means.
- Data Visualization: Create effective charts using Excel to visualize your data clearly and effectively.
By the end of this course, you will not only be proficient in using Excel for statistical process control but also be equipped with the knowledge and skills to manage any process with a data-driven approach. Enroll now to become a skilled quality personnel and master the art of data analysis using Excel! 📊🎓🌟
Course Gallery


Loading charts...