Polynomial Regression, R, and ggplot

Why take this course?
Course Title: Polynomial Regression, R, and ggplot: Mastering Curve Fitting & Data Visualization
🧮 Unlock the Secrets of Advanced Data Analysis with Charles Redmond
Course Headline:
"Dive Deep into Data: Explore Polynomial Trends with R and ggplot!"
Course Description:
Welcome to the next step in your data analysis journey! This course is a natural progression from my introductory course, "R, ggplot, and Simple Linear Regression", where we laid the foundation for understanding R and ggplot. Now, we're upping our game with Polynomial Regression in R. 📈
What You’ll Learn:
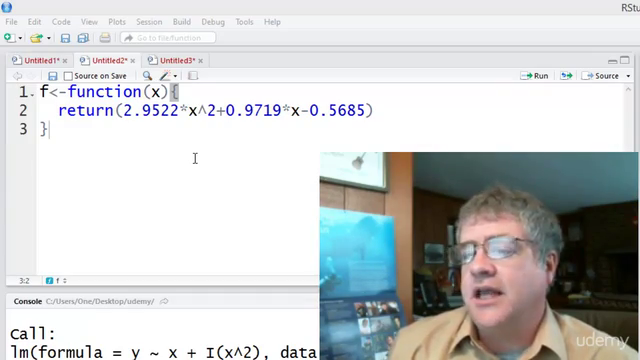
- Master Function Writing: Learn to create your own functions in R, which is a crucial skill for any data scientist or analyst.
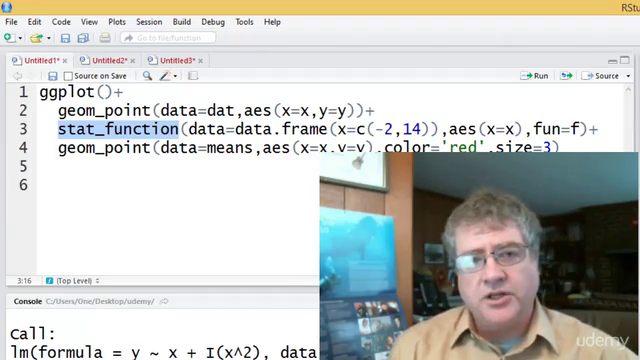
- Graphing Techniques: Enhance your visual analysis skills with ggplot, one of the most powerful and flexible visualization tools available in R.
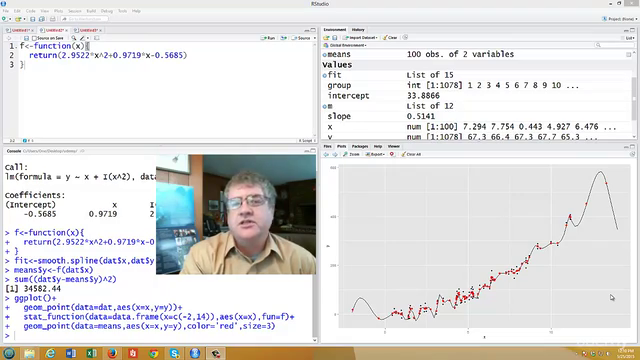
- Polynomial Fitting: Discover how to fit polynomials to data sets, unlocking deeper insights into trends and patterns within your data.
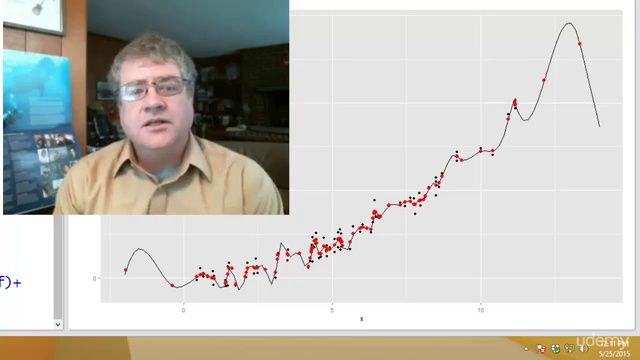
- Smoothing Splines: By the end of this course, you'll know how to fit smoothing splines to data sets, a technique that reveals hidden structures in your data.
Course Structure:
- Introduction to Polynomial Regression: Understand the principles behind polynomial regression and why it's an essential tool in data analysis.
- Writing Functions in R: Learn the syntax and practice writing functions that will automate and streamline your data workflow.
- Graphing with ggplot: Translate your functions into visual stories, learning how to plot and interpret polynomial regression models.
- Advanced Polynomial Techniques: Explore more complex polynomial models and see how they can be applied to real-world datasets.
- Fitting Smoothing Splines: Finally, learn the method of smoothing splines and apply it to understand nonlinear relationships in your data.
Prerequisites:
- R & RStudio: You should have both installed before starting this course.
- Background in R & ggplot: A solid foundation from my first course will be incredibly helpful, but if you're self-taught or come from another course, ensure you're comfortable with basic R and ggplot operations.
Course Duration: Designed for a leisurely pace over one week, this course allows you to learn at your own speed, ensuring a thorough understanding of each concept before moving on to the next.
🎓 Embark on Your Data Analysis Adventure Today! With Charles Redmond's Polynomial Regression, R, and ggplot course, you'll not only enhance your data analysis skills but also gain practical experience that will set you apart in the field of data science.
Key Takeaways:
- Comprehensive Coverage: From writing functions to fitting polynomials, every aspect of polynomial regression is covered.
- Real-World Application: Learn how to apply these techniques to real datasets, preparing you for practical challenges.
- Visualize Data Like a Pro: Master ggplot to create compelling visualizations that communicate your findings effectively.
- Flexible Learning Schedule: Complete the course at your own pace, ensuring full comprehension of each topic before progressing.
Join Charles Redmond on this journey through the world of polynomial regression and data visualization in R with ggplot. Sign up now to transform your data into powerful insights! 📊🎓
Course Gallery


Loading charts...