Machine Learning for Absolute Beginners - Level 3

Why take this course?
🚀 Embark on Your Data Science Adventure! 🌐
Machine Learning for Absolute Beginners - Level 3: Dive into the world of data visualization and master Exploratory Data Analysis (EDA) with our comprehensive online course! As we stand on the brink of the Fourth Industrial Revolution, driven by artificial intelligence and machine learning, the demand for skilled data scientists has never been higher. 🤖✨
Why Machine Learning? Why Now?
- Data science is one of the top ten wanted jobs worldwide. 🌍
- Companies across all sectors are eagerly seeking professionals who can harness the power of machine learning to drive innovation and growth. 🚀
- From tech giants to startups, your expertise in data analysis can make a tangible impact on product development, decision-making processes, and more. 🛠️✨
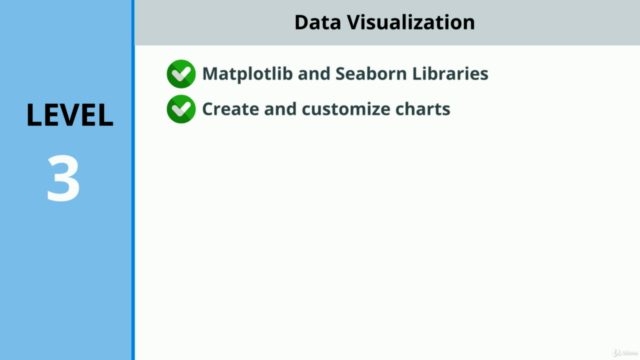
Your Journey Begins with Level 3 - Data Visualization: At Level 3, you'll turn theory into practice by learning the essentials of Python-based data visualization with Matplotlib and Seaborn, two of the most powerful libraries in the data scientist's toolkit. 📊
What You'll Learn: With our hands-on approach, you will:
-
🎨 Master Matplotlib Fundamentals:
- Understand the core concepts and functions of this versatile library.
-
🌱 Explore Seaborn Fundamentals:
- Discover how to create beautiful, informative visualizations effortlessly with Seaborn's high-level interface for Matplotlib.
-
🧐 Choose the Right Chart:
- Learn the principles of selecting the most appropriate chart type for your data and analysis needs.
-
Bar Charts:
- From simple to complex, create Bar, Grouped Bar, and Stacked Bar charts. Plus, explore Lollipop plots for a unique perspective.
-
Pie and Three-Map Charts:
- Visualize categorical data with Pie and Three-map charts to uncover trends and distributions.
-
Line Charts:
- Analyze trends over time with Line, Area, and Stacked Area charts.
-
Histograms and More:
- Use Histogram, Density plots, Box-and-Whisker plots, Swarm plots to understand the distribution of your data.
-
Scatter Plots and Beyond:
- Explore the relationships between variables with Scatter plots, Correlograms, Heatmaps, and Hexbin plots.
Hands-On Learning Experience: Each topic is followed by a summary exercise to reinforce your learning, coupled with detailed solutions to ensure you're on the right track. ✅
Join the Data Science Revolution! Enroll in "Machine Learning for Absolute Beginners" and embark on a learning journey that will transform you into a confident data scientist. With every module completed, you'll build a stronger foundation in machine learning and data science. 🎓💫
Ready to turn your passion for numbers and patterns into a career? Sign up today and start crafting compelling stories out of data that companies will value and customers will marvel at! 🚀🎉
Let's make data the hero it deserves to be. Enroll now and unlock your potential in the exciting world of machine learning and data science! 🔍💫
Course Gallery


Loading charts...