Statistical Decision Making in Data Science with Case Study

Why take this course?
🚀 Course Title: Statistical Decision Making in Data Science with Case Study 📊
🌍 Course Headline: Master the Art of Decision Making with Statistics and Python!
🎉 Welcome to the Course "Statistical Decision Making in Data Science with a Case Study in Python"! 🎓
Embark on a journey through the fascinating world of Data Science, where the power of statistics meets the versatility of Python. This course serves as an gateway to understanding the critical role that statistics plays in data-driven decision making within the field of Data Science.
Why Take This Course? 🤔
- Foundational Knowledge: Gain a solid grasp of how statistical methods underpin data science decisions and outcomes.
- Real-World Application: Engage with a compelling case study that illustrates the application of these concepts in real time.
- Practical Skills: Learn to apply statistical tests like ANOVA, t-test, and F-test within the Python environment to extract meaningful insights from data.
- Hands-On Experience: Develop your skills by building a machine learning model and interpreting its outcomes through statistical lenses.
What You Will Learn? 🚀
- Problem Statement Understanding: Dive into the intricacies of the Big Mac Index, a popular economic indicator that you will analyze for predicting dollar value fluctuations using Forex data.
- Statistical Inquiry: Learn how to formulate and answer statistical questions effectively.
- Linear Regression Mastery: Get hands-on experience with linear regression (including least squares regression) and understand how to implement it in Python.
- Output Interpretation: Grasp the significance of MSE, Degrees of Freedom, and learn how to interpret the outputs of your models.
- Hypothesis Testing: Master the art of t-tests for coefficient significance and F-tests for model significance, as well as explore ANOVA for a deeper understanding of comparative statistics.
- Correlation & R-Square: Discover the strength and significance of relationships between variables using correlation coefficients and understand how to evaluate model fit with R-squared values.
Course Structure: 📚
-
Introduction to Statistical Decision Making in Data Science
- Understanding the role of statistics in data science.
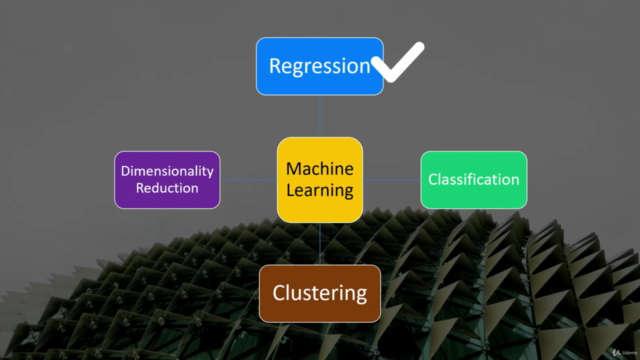
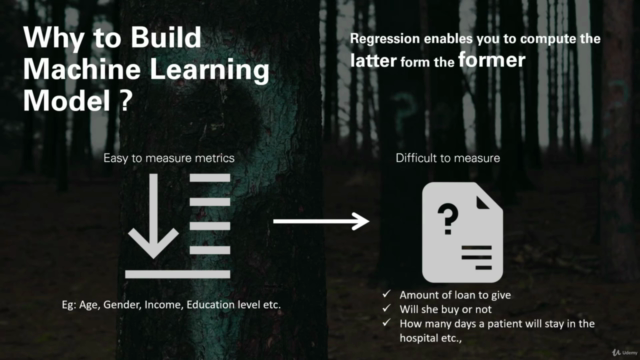
- Overview of machine learning and its goal in data science.
-
Case Study: The Big Mac Index
- Problem statement analysis.
- Data collection and preparation.
-
Building the Model: Linear Regression in Python
- Least squares regression implementation.
- Model optimization and parameter tuning.
-
Statistical Tests & Their Interpretation
- T-test for coefficient significance 📈
- F-test for model significance 🔍
- ANOVA for comparing multiple models 🧪
-
Understanding Model Outputs
- Mean Squared Error (MSE) and its importance 🎯
- Degrees of Freedom in statistical tests ⚖️
-
Correlation & R-Square Analysis
- Exploring relationships between variables 📊
- Evaluating model fit with R-squared values 🏗️
Join us on this analytical adventure and transform the way you approach decision making in data science. By the end of this course, you'll not only have a deeper understanding of statistical methods but also be equipped with the ability to apply these techniques using Python. Sign up now and turn data into decisions! 🌟
Course Gallery


Loading charts...