Learning Python for Data Analysis and Visualization Ver 1

Why take this course?
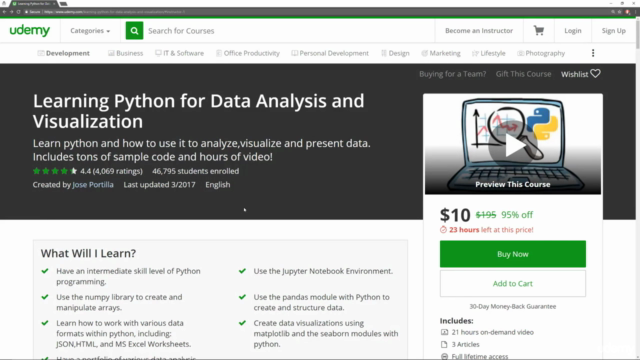
🚀 Course Title: Learning Python for Data Analysis and Visualization Ver 1
🎓 Headline: Dive into the World of Data with Python! 📊✨
Course Description:
Unlock the Power of Python in Data Science!
Are you ready to embark on an exciting journey into the realm of data analysis and visualization using Python? Whether you're a complete beginner or looking to sharpen your skills, this comprehensive course is tailored to take you from a novice to a proficient Python programmer, with a focus on handling and interpreting data.
What You'll Learn:
-
🤖 Python Programming Fundamentals: Grip the basics of Python and understand its syntax and structure to build a strong coding foundation.
-
📊 Data Manipulation with Numpy & Pandas: Master the art of creating and manipulating arrays and data frames using powerful libraries like NumPy and Pandas, enabling you to handle large datasets efficiently.
-
📈 Data Visualization Techniques: Learn to craft compelling visualizations using Matplotlib and Seaborn libraries, turning complex datasets into insightful graphs and charts that tell a story.
-
🧠 Machine Learning with SciKit Learn: Get an introduction to the basics of machine learning and learn how Python can be used to make predictions and build models using SciKit Learn.
Your Course Includes:
-
Extensive Video Content: Hours of engaging video lectures that walk you through each topic with clarity and depth.
-
100+ Example Code Notebooks: Access a vast collection of code examples across various projects, which you can use to build your data analysis portfolio.
-
Project-Based Learning: Work on real-world data analysis projects that will prepare you for practical challenges in the field.
-
Lifetime Access & Updates: Enjoy lifetime access to all course materials, including new and updated videos and future project additions.
By the End of This Course, You Will Be Able To:
-
Program confidently in Python, understanding its core concepts and practical applications.
-
Create, manipulate, and analyze data sets with numpy and pandas.
-
Generate captivating visualizations to represent your findings.
-
Develop a portfolio of python data analysis projects, showcasing your skills to potential employers.
-
Apply basic machine learning concepts using SciKit Learn.
Why Choose This Course?
With over 100 lectures and more than 20 hours of content, this course is designed to provide you with a comprehensive understanding of Python for data analysis and visualization. It's not just about the code; it's about understanding how to think like a data scientist.
Whether you're aiming for a career transition into data science or looking to add valuable skills to your current role, this course is the perfect stepping stone. 🌟
Enroll Now and Transform Your Data Skills with Python!
Remember to review all course details to ensure this version aligns with your learning goals. Welcome to the data revolution with Python at your fingertips! 🚀💻
Course Gallery


Loading charts...
Comidoc Review
Our Verdict
This course offers a solid foundation in essential data manipulation and visualization tools such as pandas, numpy, and plotting. Though the content is outdated, the instructor's explanations remain clear and comprehensive, covering various topics from basic to advanced techniques. However, be prepared for deprecated functions and syntax errors throughout the course, requiring external assistance for solutions. This course may not be suitable for those seeking up-to-date knowledge in data analysis and visualization using Python.
What We Liked
- Comprehensive coverage of pandas, numpy, and plotting with clear explanations
- Wide range of topics from basic to advanced techniques
- Instructor is knowledgeable and provides valuable learning experience
- Includes a portfolio of data analysis projects
Potential Drawbacks
- Outdated content with some functions no longer available or deprecated
- Lack of updates hinders applicability to latest changes in field
- Randomly created datasets may not help build knowledge effectively
- Code syntax errors require external solutions