Learning Path: R: Powerful Data Analysis with R

Why take this course?
📚 Master R for Advanced Data Analysis 🚀
Embark on a comprehensive learning journey with our "Learning Path: R: Powerful Data Analysis" course, designed to equip you with the skills to harness the power of R and tackle complex data analysis challenges in real-world scenarios. 🧐
Why Learn R for Data Analysis?
- Data Deluge: In today's data-driven world, the volume of data being generated is staggering. As a data analyst, your role is pivotal in making sense of this information to drive informed decision-making.
- R's Dominance: R stands out as one of the leading tools for statistical analysis and graphics, providing a plethora of packages that cater to various aspects of data science.
Course Highlights:
📊 Introduction to R and CRAN 🌐
- Get acquainted with the Comprehensive R Archive Network (CRAN) and understand why it's a crucial resource for R users.
➖➕ Data Importing & Manipulation 💻
- Master the basics of importing data, even from compressed sources on the Web, setting you up for data manipulation tasks.
📈 Static vs. Interactive Data Visualization 🧱
- Create static plots to visualize your data effectively.
- Extend your skills to plot spatial data on interactive platforms like Google Maps and OpenStreetMap, making your visualizations accessible to a broader audience.
🔍 Advanced Data Analysis Techniques 🔧
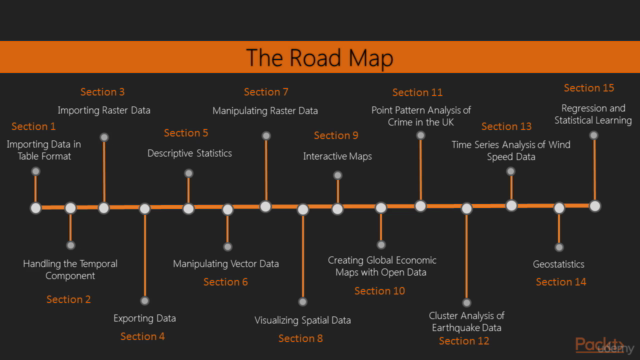
- Explore the depths of data analysis with cluster analysis, time-series analysis, association mining, PCA (Principal Component Analysis), handling missing data, and sentiment analysis.
- Dive into spatial data analysis using R alongside QGIS for mapping and geospatial analysis.
- Enhance your visualizations with advanced techniques using the ggplot2 library.
🌍 Real-World Applications 📊
- Apply your newfound knowledge to real-world datasets from various sectors, including finance, healthcare, and environmental research.
Expert Guidance: This course is crafted with insights from leading experts in the field:
-
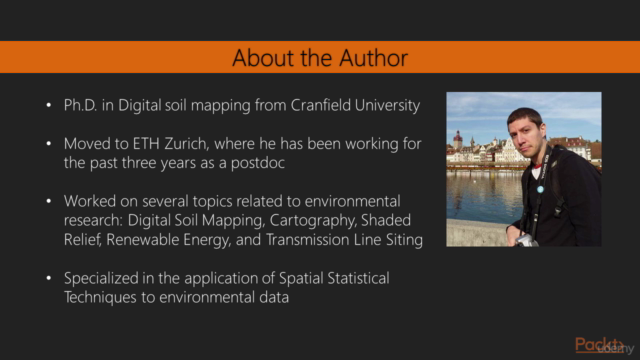
Fabio Veronesi, Ph.D. 🌾
- Specializes in spatial statistical techniques for environmental data analysis.
- Has a rich background in digital soil mapping and renewable energy research.
-
Dr. Bharatendra Rai 🏫
- A seasoned professor with expertise in Business Statistics, Operations Management, and Data Science for Business.
- Teaches courses on Analyzing Big Data, Business Analytics, and Data Mining.
Your Learning Path:
- Getting Started with R: Learn the essentials of R programming and how to use CRAN.
- Data Importing & Preparation: Understand various methods for importing data into R.
- Basic Data Visualization: Create static plots to represent your data clearly and effectively.
- Interactive Data Visualization: Learn to visualize spatial data on popular web platforms.
- Advanced Data Analysis Techniques: Master cluster analysis, time-series analysis, PCA, handling missing data, sentiment analysis, and more.
- Spatial Data Analysis with R & QGIS: Combine R with QGIS for powerful spatial data analysis.
- Data Visualization with ggplot2: Enhance your visualizations with advanced techniques from the ggplot2 library.
- Real-World Application: Analyze real-world datasets and apply the concepts you've learned to make a tangible impact.
By the end of this Learning Path, you will be well-equipped to perform in-depth data analysis using R on real-world datasets, making you a valuable asset in any industry that relies on data-driven decision-making. 🌟
Ready to become an expert in data analysis with R? Enroll in our "Learning Path: R: Powerful Data Analysis" course today and transform your career!
Course Gallery


Loading charts...