Learn to Create Advanced Charts in Tableau

Why take this course?
🚀 Learn to Create Advanced Charts in Tableau 🚀
Unlock the Full Potential of Data Visualization with Harshit Srivastav!
📚 Course Title: Advanced Custom Charts in Tableau
🎉 Headline: Master Gauge, Clustering, & Animation Charts in Tableau Desktop with this Comprehensive Course!
🚀 Welcome to Advanced Tableau! 🚀
Embark on a journey to transform your data into compelling visual narratives. This course is designed for learners eager to move beyond the basics and harness the full power of Tableau's advanced charting capabilities. With Harshit Srivastav as your guide, you'll master the art of creating sophisticated custom charts that will set your data visualizations apart.
Why Take This Course?
✅ Diverse Learning Experience: Whether you're a seasoned Tableau user or new to the platform, this course is crafted to cater to various proficiency levels. You'll learn through practical examples and real-world applications.
✅ Hands-On Approach: By leveraging both Tableau Desktop and Tableau Public, you'll apply what you learn in an interactive environment that mirrors the challenges of real-life data analysis.
✅ Spreadsheet Skills: You'll also gain proficiency with a spreadsheet editor like Microsoft Excel to manipulate your data effectively before visualizing it in Tableau.
🎓 Course Highlights 🎓
-
Prerequisites: Basic hands-on experience with Tableau, including importing datasets, creating simple charts, and basic navigation. (Don't worry if you're a beginner; this course will guide you through every step!)
-
Software Requirement: Use Tableau Desktop or Tableau Public to create visualizations, along with a spreadsheet editor like Microsoft Excel.
-
Business Intelligence Mastery: As a leading Business Intelligence tool, Tableau is integral for data analysts and visualization experts who drive critical business insights and informed decision-making. This course will elevate your skills to meet the growing demand for advanced Tableau users in various industries.
🔍 Advanced Custom Charts You'll Master 🔍
-
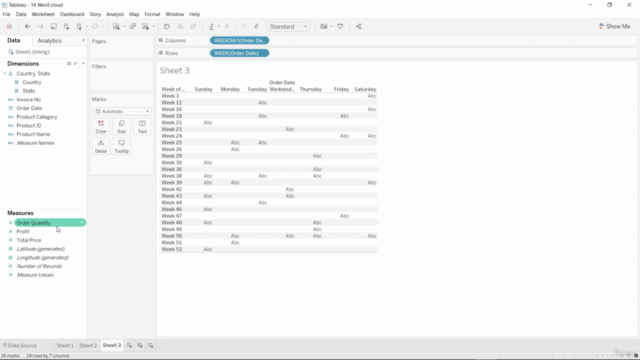
Word Cloud: Visualize text data in a powerful and easy-to-understand format.
-
Custom Map: Transform your geographical data with custom visualizations.
-
Lollipop Chart: Display quantitative data with an innovative and informative chart type.
-
Background Map Display Modes: Learn different ways to overlay your data onto a map background for better context.
-
Butterfly Chart: Analyze multivariate data with this unique and insightful chart.
-
Funnel Chart: Track processes or sales funnels with a dynamic visual representation.
-
Heatmap Date: Understand spatial relationships and trends over time with heatmaps.
-
Calculated Field: Dive into the power of calculated fields to create complex, custom calculations.
-
Density Map: Visualize data density across a geographic area for deeper insights.
-
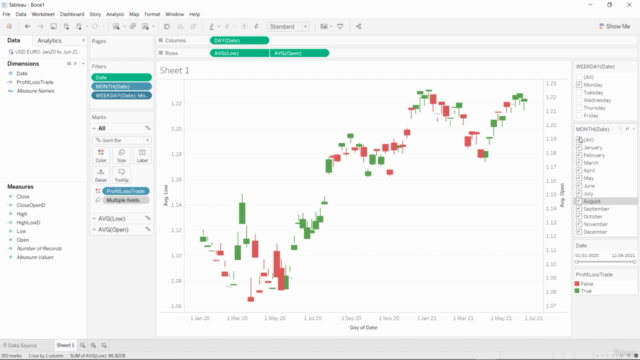
Candlestick Chart: Analyze financial data with this widely used chart in financial markets.
-
Sunburst Chart: Explore hierarchical data with a radial, treemap style visualization.
-
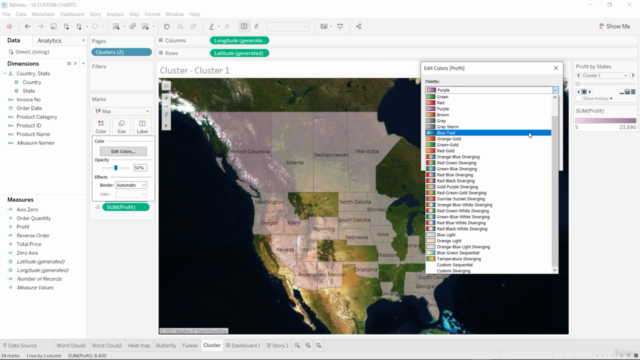
Clustering: Discover patterns and groupings within your data through clustering techniques.
-
Animation Playback: Bring your charts to life with animations that can tell the story of data changes over time.
-
Creating a Story: Craft a compelling narrative around your data to communicate findings effectively.
-
Creating a Dashboard: Combine multiple visualizations into an intuitive and actionable dashboard.
📊 What is Tableau? 📊
Tableau is a robust Business Intelligence tool that empowers users to create impactful data visualizations, perform data cleaning, and prepare data for analysis. By mastering advanced features of Tableau, you'll open doors to various career opportunities in data science, business analytics, and beyond.
🌟 Ready to Elevate Your Data Visualization Skills? Enroll Now! 🌟
Embark on this transformative learning journey today and become a Tableau virtuoso! With Harshit Srivastav's guidance, you'll not only learn advanced custom charts but also how to incorporate them into meaningful business intelligence tools. Transform data into stories that matter. 📊💫
Sign up now and take your first step towards becoming a Tableau expert!
Course Gallery


Loading charts...