MS Excel: Statistics and Data Analysis
Why take this course?
🚀 Course Title: MS Excel: Statistics and Data Analysis
Headline: Master Statistical Analysis with MS-Excel's Analysis Toolpak 📊✨
Course Description:
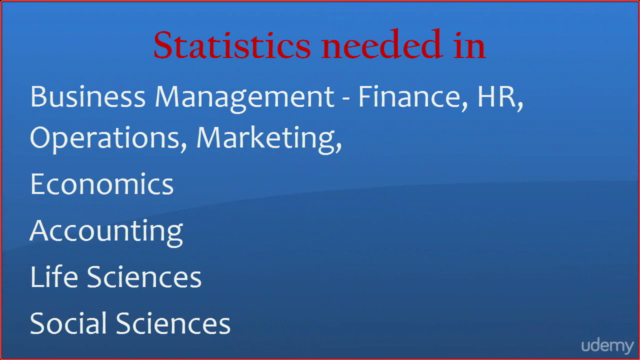
In the era of data deluge, where every organization relies on data for informed decision-making, the ability to analyze and interpret this data is invaluable. From bustling startups to industry-leading conglomerates, the need for professionals skilled in data analytics has never been greater. MS Excel: Statistics and Data Analysis is your gateway into the world of data analysis using one of the most widely used tools - Microsoft Excel.
Why Take This Course?
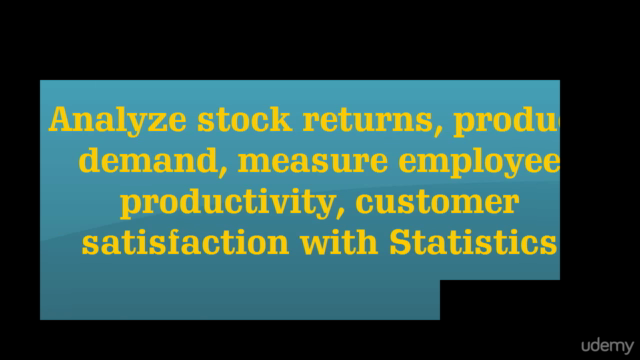
- Data-Driven Decisions: Learn to transform raw data into actionable insights that drive business decisions.
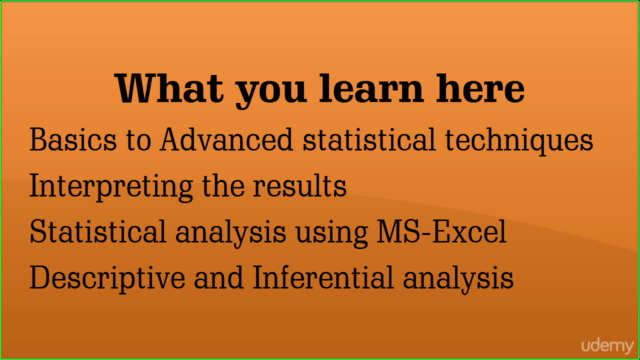
- Statistical Mastery: Gain a comprehensive understanding of statistical concepts essential for data analysis.
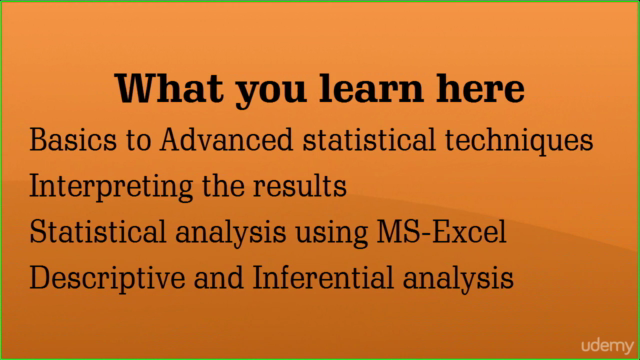
- Excel Proficiency: Enhance your Excel skills with the Analysis Toolpak, which offers a suite of tools for complex data analysis.
- Practical Application: Apply statistical methods to real-world datasets through practice workbooks tailored to solidify your learning experience.
What You'll Learn:
- 📈 Descriptive Statistics: Summarize and understand your data with measures of central tendency, variance, and more.
- 🔬 Inferential Statistics: Make educated guesses about a population using sample data through hypothesis testing and confidence intervals.
- 📊 Correlation & Regression: Explore the relationships between variables to predict outcomes or identify trends.
- 🎯 Pivot Tables & Charts: Organize, summarize, and present your data in a clear and informative manner.
- 🛠️ Excel Toolpak Functions: Utilize powerful functions like linear regression, t-tests, ANOVA, and more.
Course Features:
- Step-by-Step Video Tutorials: Visual guides to help you grasp complex concepts with ease.
- Interactive Exercises: Hands-on practice to reinforce your learning and build confidence in applying statistical methods within Excel.
- Downloadable Workbooks: Exclusive access to workbooks for individual and group exercises, tailored to enhance your analytical skills.
- Real-World Case Studies: Understand how statistics and data analysis play a role across various industries.
Who Is This Course For?
- Aspiring Data Analysts and Statisticians
- Business Analysts
- Financial Analysts
- Marketers
- Researchers (Social Science, Market Research, etc.)
- Anyone interested in learning data analysis using Excel
Join us on this journey to unlock the secrets of your data with MS Excel: Statistics and Data Analysis. Elevate your career by mastering the tools that drive data-centric decision making. 🌟
Enroll now and step into the world of data analytics! 🚀💫
Course Gallery
Loading charts...