Power BI Express: Unleashing Microsoft PowerBI in 6 Hours

Why take this course?
It seems you've provided a comprehensive list of topics related to Power BI, which is a powerful business analytics tool from Microsoft. Let's delve into each topic to enhance your understanding and skills in using Power BI effectively for data analysis and visualization.
Creating Tables for Detailed Data Representation
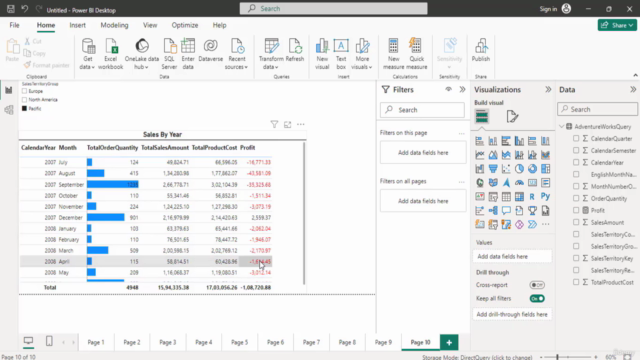
Tables are fundamental in Power BI for displaying detailed data. They can be used to show summarized data, or as a reference for other more complex visuals like matrices and treemaps.
Implementing Slicers for Interactive Filtering
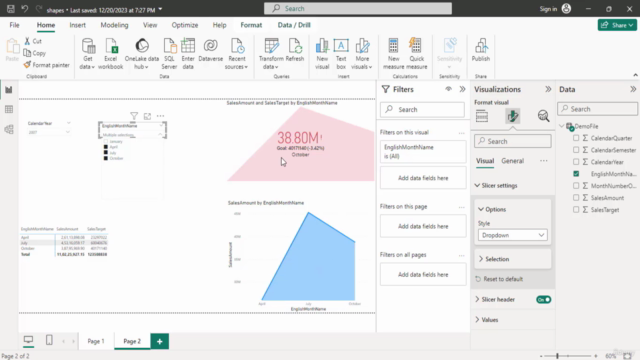
Slicers allow users to filter the data displayed in a report interactively. This is particularly useful when you have large datasets and want to focus on specific segments without altering the underlying data model.
Leveraging Conditional Formatting for Emphasis
Conditional formatting enables you to highlight important data points within your visuals, making it easier to spot trends or outliers in your dataset.
Cascading Dropdowns for Refined Data Selection
Cascading dropdowns enable users to make a selection from a list that updates another related list. This is useful when you have hierarchical or nested data.
Understanding Matrices and Treemaps
Matrices and treemaps are advanced table visualizations that can show complex data structures in an easy-to-understand format, facilitating the exploration of multidimensional datasets.
Using Charts Effectively
Charts can be used to visualize a wide variety of data types and help users identify patterns and trends more quickly than tables alone.
Utilizing Analytics and DAX for Advanced Data Analysis
DAX (Data Analysis Expressions) is the formula language of Power BI. By using DAX, you can create calculated columns, measures, and complex calculations to derive meaningful insights from your data.
Creating Dashboards in Power BI
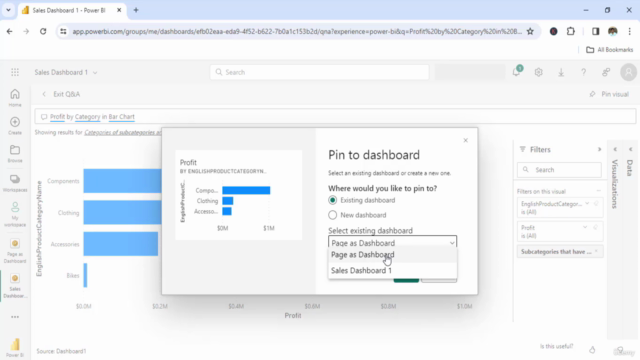
Dashboards are a collection of visualizations that provide an at-a-glance view of performance metrics and KPIs. They are crucial for storytelling and decision-making.
Sharing and Collaborating with Others
Power BI enables collaboration by allowing you to share reports and dashboards with others, either within your organization or externally, with appropriate permissions.
Managing Data Refresh Schedules
Data refresh capabilities in Power BI allow you to keep your data up-to-date automatically by refreshing data from various sources like databases, Excel files, and cloud services on a schedule.
Understanding Licensing Tiers for Power BI
Knowing the different licensing options (Pro, Pro Premium, and Embed) is important to ensure you have the right level of access and functionality for your organization's needs.
Working with Power BI Mobile App
The mobile app allows users to view and interact with reports and dashboards on their mobile devices, making data available anytime and anywhere.
Testing Interactive Features in Power BI Service
Power BI's service provides various interactive features like bookmarks and report page tooltips that can be tested to ensure they work as expected and provide a seamless user experience.
Ensuring Data Security with Row Level Security (RLS)
Row Level Security allows you to protect sensitive data by restricting access to rows in your dataset based on the user's identity or membership in specific security groups.
Adapting Reports for Mobile Consumption
Creating mobile layouts for reports ensures that the content is optimized for smaller screens and touch interactions, enhancing the user experience on mobile devices.
Validating Interactive Elements in Power BI Service
It's important to test interactive elements like bookmarks and tooltips to ensure they function correctly and help users navigate through your report more effectively.
By understanding these topics, you can leverage the full potential of Power BI to create informative, interactive, and visually appealing reports and dashboards that will aid in data-driven decision-making within your organization.
Course Gallery


Loading charts...