Power Bi Data Analysis - Create Dashboards in Power Bi - P2

Why take this course?
🚀 Master Power BI with Our Comprehensive Online Course!
🎉 Discover the Power of Data Analysis & Visualization
🔍 About This Course: This engaging course is designed to equip you with the essential skills needed to create dynamic reports and interactive dashboards using Microsoft Power BI. 📊✨
🌟 Who Is This Course For?
- Data Analysts
- Business Intelligence Professionals
- Aspiring Data Scientists
- Any individual or team looking to transform data into actionable insights with Power BI.
🚀 What You Will Learn:
-
Understanding Power BI: A comprehensive introduction to Microsoft's Business Intelligence tool, designed for end users to create their own reports and dashboards.
-
Power BI Desktop: Master the art of creating rich interactive reports with visual analytics right at your fingertips. Connect to over 65 data sources and bring your data to life!
📈 Key Course Topics:
-
Data Analysis with DAX: Learn to perform complex calculations with ease using Microsoft's Data Analysis Expressions (DAX).
-
Power Query: Discover how to manipulate and prepare your data for analysis with the Power Query Editor.
-
Visualizations & Dashboards: Create compelling charts, graphs, and dashboards that tell a story with your data.
-
Data Models & Relationships: Build robust data models and establish relationships between different data sources to gain meaningful insights.
-
Custom Reports: Learn to tailor reports with filters, drill-throughs, and relative date filters for a more interactive experience.
🔧 Hands-On Learning:
-
Step by Step Instructions: Follow along with our detailed step-by-step guide to ensure you understand each aspect of Power BI.
-
Real-World Scenarios: We've tailored our content to be relevant to real-world business challenges, ensuring you can apply your new skills immediately.
📚 Course Structure:
-
Introduction to Power BI: Get to know the Microsoft Power Platform and its significance in Business Intelligence.
-
Connecting Data Sources: Learn how to connect to various data sources using Power Query and understand how to clean, transform, and model your data effectively.
-
Working with Data Models: Dive into creating and optimizing data models and DAX measures to extract valuable insights.
-
Visualization Techniques: Explore different visualization techniques to represent your data in the most effective way.
-
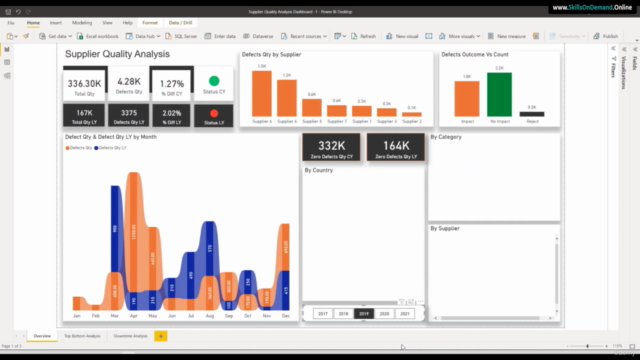
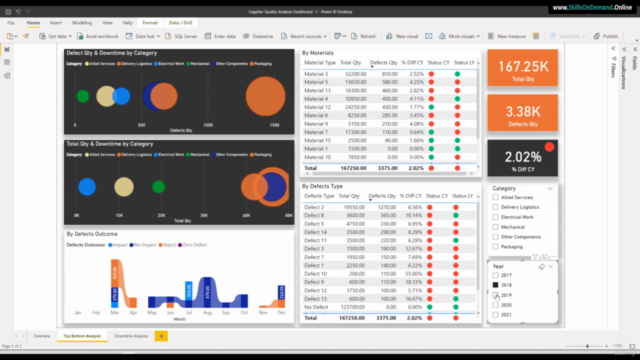
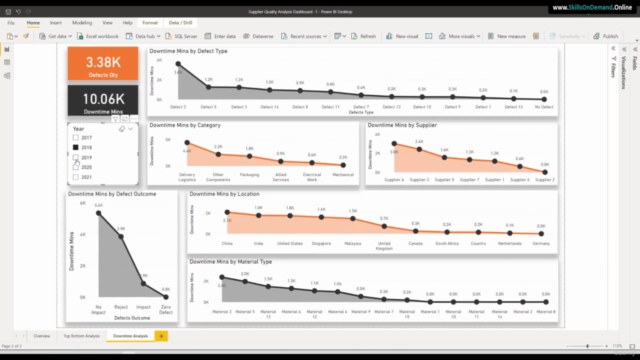
Building a Supplier Quality Analysis Dashboard: Learn how to build and manage a comprehensive multi-page dashboard within Power BI.
🎓 Skills You Will Master:
- Mastery of DAX formulas 📈
- Proficiency with Power Query and M Language 🔄
- Advanced chart and graph creation 📊
- Techniques for building interactive reports and dashboards 🖥️
- Application of themes and custom visualizations to enhance your reports 🎨
📅 Get Started Today! Embark on your journey to becoming a Power BI expert. With our comprehensive course, you'll unlock the potential of your data and become a vital asset in any analytics or business intelligence role. 🚀
Ready to transform your data into insights? 📈 Enroll Now and take the first step towards mastering Power BI!
Course Gallery


Loading charts...