Google Data Studio: Master Data Visualization and Analytics

Why take this course?
🎉 Master Google Data Studio for Data Visualization and Analytics!
🚀 Course Title: Google Data Studio: Master Data Visualization and Analyticscourse by Harshit Srivastav
📈 Headline: Unleash the Power of Data with Google Data Studio – From Zero to Data Hero!
Dive into the world of data with our comprehensive online course, where you'll master Google Data Studio (GDS), a powerful tool for data visualization and analytics. This course is meticulously designed to take you from the basics to advanced levels of creating insightful business intelligence reports and captivating data visualization charts.
Why Choose This Course?
- Practical Skills: Learn through hands-on examples, ensuring you can apply what you learn directly to your own data sets.
- Versatile Applications: Gain skills applicable across various roles in Data Visualization, Data Analysis, Business Intelligence, and Data Science.
- In-depth Curriculum: Explore the full potential of GDS by creating a variety of charts such as Pie, Bar, Ring, Treemap, Google Map, Heat map, Bubble chart, Time series chart, and more!
Course Highlights:
- 📊 Comprehensive Reporting: Learn to create Business Intelligence Reports from scratch, complete with visualization charts.
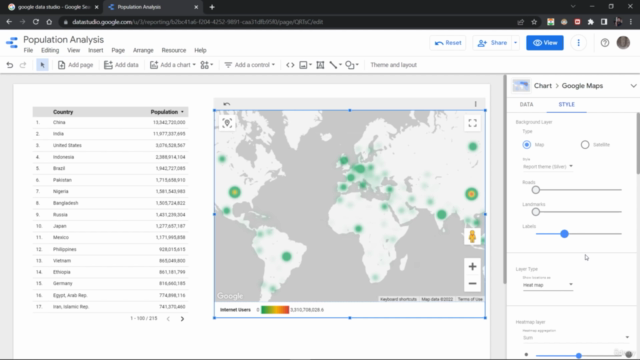
- 🌍 Geospatial Insights: Master adding and customizing Google Map charts to provide geographic context to your data.
- 🍏 Interactive Dashboards: Craft dynamic Treemap charts with filters for a more nuanced understanding of your data.
- ⏳ Time-Series Analysis: Utilize Time series charts to bring historical and time-dependent data to life in your reports.
- 🛠️ User Interaction: Enhance your dashboards with Controllers, including Input boxes and Drop down lists, for a more interactive user experience.
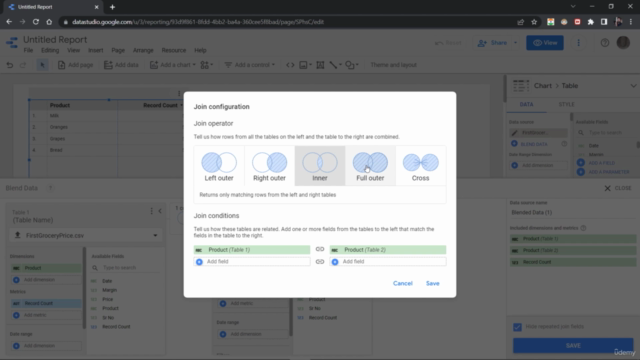
- 📉 Data Blending Techniques: Learn advanced data blending using joins like Left Outer, Right Outer, Inner, Full outer, Cross to combine multiple datasets and extract comprehensive insights.
What You Will Learn:
- Creating a Business Intelligence Report – Start with the basics of creating BI reports in GDS and gradually build your way up to advanced features.
- Customizing Map Charts – Discover how to visualize data on maps, highlighting specific areas, and understanding spatial relationships within your datasets.
- Treemap Charts with Filters – Learn to represent hierarchical data in a Treemap format and how to apply filters for more granular analysis.
- Time-Series Dashboards – Understand the dynamics of trends over time using Time series charts that are interactive and informative.
- User Controllers – Add interactivity to your dashboards by implementing Input boxes, Drop down lists, and other controllers for a more engaging user experience.
- Data Blending Techniques – Master the art of blending datasets using different types of joins to gain a holistic view of your data.
- Downloading & Sharing BI Reports – Export your reports and share them with stakeholders for real-world decision making.
- Uploading Datasets – Import data from CSV files into GDS, preparing it for analysis and visualization.
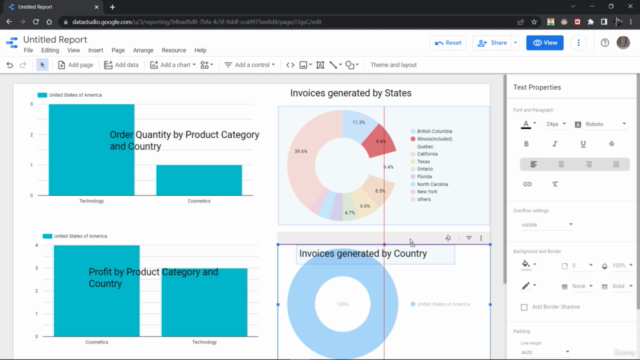
- Text Annotations & Insights – Add descriptive text to your dashboards and use interactive charts to draw valuable insights from the dataset.
By the end of this course, you'll not only have a solid understanding of Google Data Studio but also be equipped with the skills to turn complex data sets into clear, actionable visualizations. Whether you're looking to enhance your professional skill set or simply explore the capabilities of GDS, this course will guide you every step of the way.
🎓 Embark on your journey to becoming a data visualization expert today! Enroll now and transform the way you interact with data!
Course Gallery


Loading charts...