Data Warehousing & Visualization in Microsoft BI & Power BI

Why take this course?
📊 Data Warehousing & Visualization in Microsoft BI & Power BI 🚀
Course Headline: Dive into the world of Data Science with our comprehensive course on Data Warehousing, ETL Processes, and Advanced Data Visualization using Microsoft Excel, Microsoft Business Intelligence (BI) tools, and Power BI. Get ready to become a data wizard! 🧙♂️✨
Course Title: Data Science Guide: Mastering Data Warehousing & Visualization with Microsoft BI & Power BI
Data Warehousing:
Unlock the secrets of data warehousing with a focus on Extraction, Transformation, and Loading (ETL) processes. This course will guide you through:
- 📋 Data Cleaning in Microsoft Excel: Learn to clean your datasets effectively, ensuring accurate analysis later on.
- 🛠️ SQL Server Integration Services (SSIS): Master SSIS for a smooth and error-free ETL experience. Discover shortcuts and techniques that will save you time and hassle.
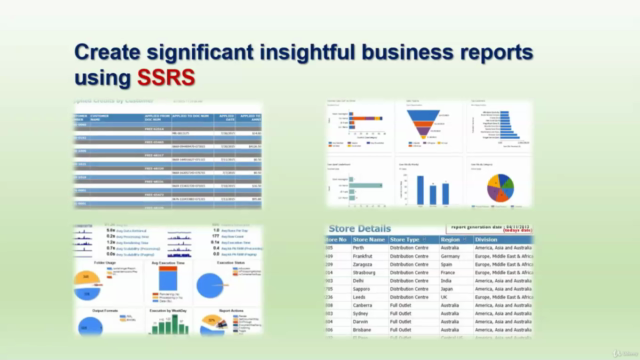
- 📊 SQL Server Reporting Services (SSRS): Create compelling business reports and perform deep data analysis with SQL queries.
- 👨🏫 Hands-On Practice: Engage with real-world projects that simulate diverse business scenarios, solidifying your skills through practical application.
Why practice? Because knowledge is not just absorbed, it's constructed through experience. By working on tangible projects, you'll truly understand the nuances of data warehousing.
Power BI:
Transform raw data into a visual story with Power BI. This course will take you from novice to proficient as you learn:
- 📈 Data Visualization Fundamentals: Understand the importance of data visualization and how it can turn numbers into narratives.
- 🧪 Power BI Services Explained: Get to grips with each Power BI service and their roles in your data analysis journey.
- 🎯 Navigating Power BI Desktop: Learn the ins and outs of Power BI Desktop, setting you up for powerful data manipulation and visualization.
- ⚙️ Powerful Data Preparation Functions: Utilize advanced functions in the Power BI Editor to prepare and clean your datasets.
- 🔗 Merging Datasets: Combine multiple datasets into one cohesive dataset, enabling you to analyze data from multiple sources simultaneously.
- 📉 Creating Charts & Reports: Turn your data into compelling charts with Power BI's powerful functions and filters. Tailor your visualizations to meet specific business needs.
- ✎ Measures and Calculated Columns: Learn how to create custom measures and calculated columns for in-depth data analysis.
- 📋 Introduction to DAX Language: Craft new tables and columns using the DAX language, enhancing your ability to analyze data from unique perspectives.
- 🌍 Cloud Integration: Take your projects to the cloud, collaborating with others and sharing your insights in real-time.
- 🚀 Power BI Pro Interface: Create, edit, and share reports using the Power BI Pro interface, making your analysis accessible to a wider audience.
Why Choose This Course?
- 🎓 Expert Instructors: Learn from seasoned professionals who are experts in their field.
- 🛠️ Real-World Scenarios: Apply what you learn through practical, real-world case studies.
- 💡 Interactive Learning Experience: Engage with content that encourages active learning and problem-solving.
- 🤝 Community Support: Join a community of like-minded learners to share knowledge and experiences.
Embark on your journey to becoming a data science expert today! Enroll in our Data Warehousing & Visualization in Microsoft BI & Power BI course and unlock the full potential of your data analysis skills. 🌟
Course Gallery


Loading charts...