Data Visualization in Tableau & Power BI (2 Courses in 1)

Why take this course?
🎉 Master Data Visualization with Tableau & Power BI: A Comprehensive Learning Journey 📊✨
Course Title: Data Visualization in Tableau & Power BI (2 Courses in 1)
Course Instructor: [Your Name]
Embark on a transformative data journey where you'll learn to harness the power of Tableau and Power BI from beginner to expert levels. This isn't just a course—it's a deep dive into the world of data visualization, where you'll tackle real-life projects that will sharpen your analytical skills and elevate your understanding of data representation.
What You'll Learn with Tableau:🔹
- Getting Started: Installation, interface navigation, and mastering the main menus and functions.
- Data Connection: Connect to various data sources and formats, ensuring you can work with the data you need.
- Data Preparation: Transform raw data into a format suitable for analysis and visualization.
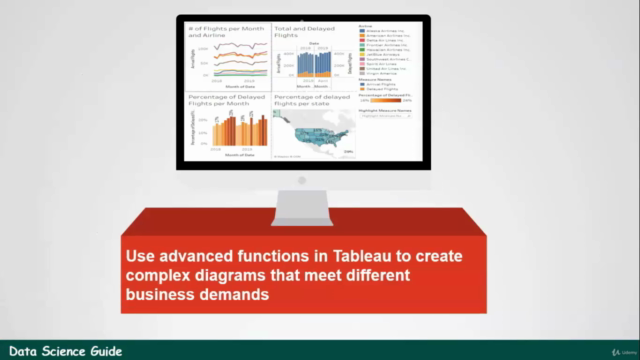
- Advanced Techniques: Leverage data joins, blending, calculated fields, dual axis combinations, table calculations, and more to create advanced visualizations.
- Analytical Functions: Utilize Tableau's advanced analytical functions to make your charts even more powerful.
What You'll Learn with Power BI:🔹
- Data Visualization Fundamentals: Understand the importance of data visualization and its impact on decision-making.
- Power BI Services: Explore and become familiar with the various services that Power BI offers.
- Navigating Power BI Desktop: Learn how to install, navigate, and start creating your first interactive reports.
- Data Preparation in Power BI: Discover how to clean datasets, append and merge them, and prepare your data for analysis.
- Creating Charts with Advanced Functions: Turn your prepared datasets into insightful visualizations using advanced Power BI Editor functions.
- Filtering Data: Learn to filter your data according to specific business requirements to gain precise insights.
- DAX Language Basics: Get an introduction to the DAX language and learn how to create new tables, columns, and measures to enhance your data analysis capabilities.
- Sharing & Collaboration: Take your projects to the Cloud and learn how to collaborate with others using Power BI Pro interface, creating, editing, and sharing reports seamlessly.
Why This Course? 🚀
- Hands-On Experience: Learn by doing with real-life projects that reflect actual business scenarios.
- Step-by-Step Guidance: From the basics to advanced techniques, you'll be guided every step of the way.
- Industry-Relevant Skills: Equip yourself with skills that are in high demand across various industries.
- Flexible Learning: Access the course content at your own pace and on any device—learn anytime, anywhere.
Who Is This Course For? 🎓
- Aspiring Data Analysts looking to build their data visualization skills.
- Current Data Scientists seeking to expand their repertoire with Tableau and Power BI.
- Professionals in business intelligence who want to understand how these tools can provide deeper insights.
- Anyone interested in learning how to represent large datasets through engaging and informative visualizations.
Join us on this data adventure and transform your approach to data analysis. With expert guidance, hands-on practice, and real-world applications, you'll be well on your way to becoming a data visualization expert! 🌟
Enroll now and unlock the full potential of your data! 💻🌍
Course Gallery


Loading charts...