Power Bi - Master Power Bi with 40+ hours of Premium Content
Why take this course?
🌟 Master Power BI with 40+ Hours of Premium Content 🌟
Power BI Master Class Overview
🚀 Elevate Your Data Analysis Skills
This course is designed to empower you with advanced Power BI analysis and data visualization skills. You'll learn to build dynamic reports and interactive dashboards, interpret meaningful insights from any dataset, and become a pro at using Microsoft Power BI as a Business Intelligence tool. 📊💡
What You Will Learn
🌍 Real-World Applications
We've tailored the content to be relevant to real-world scenarios, ensuring that you can apply your newfound skills effectively in any business environment. 🌐
👉 Analyze Data with Precision
Power BI is a part of the comprehensive Microsoft Power Platform and stands out as a business analytics and business intelligence service. It offers an intuitive interface that allows end users to create their own reports and dashboards without needing extensive technical knowledge. 🛠️✨
Key Features of Power BI Desktop
- Rich Interactive Reports: Create visually immersive and insightful reports with visual analytics at your fingertips.
- Versatile Data Connections: Connect to over 65 on-premises and cloud data sources, turning raw data into actionable insights.
- Powerful Visualization Techniques: Use Power BI Desktop to design, create, and analyze dashboards and reports.
📈 Hands-On Learning with Practical Exercises
Throughout the course, you will:
- Connect to data sources using Power Query.
- Clean, transform, and model your data for optimal analysis.
- Build complex data models and create DAX measures.
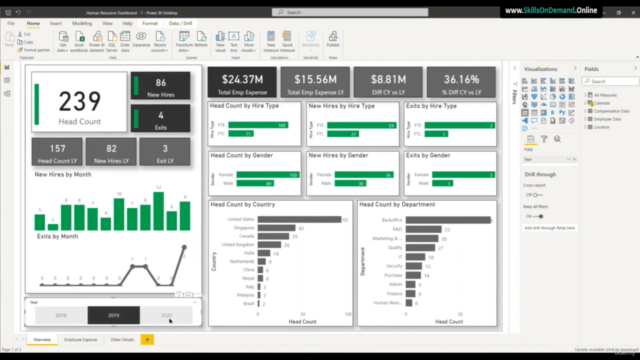
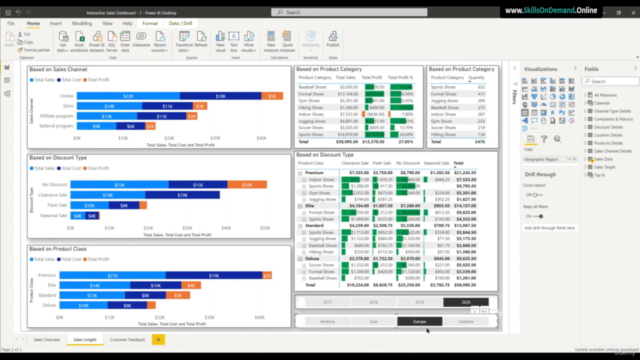
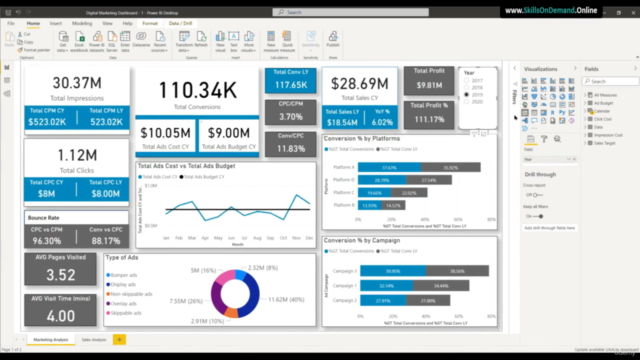
- Design interactive dashboards that provide deep insights into your data.
- Analyze trends and patterns, and make accurate forecasts.
- Work with hierarchies, timeseries, and Power BI's Q&A feature to extract hidden insights.
Course Curriculum Highlights
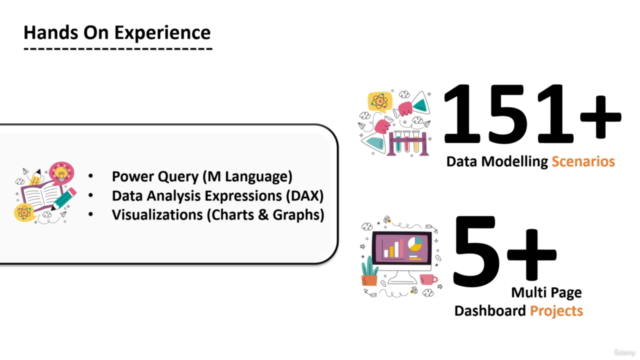
- 151 Real-Life Data Modeling Examples: Gain expertise in data modeling with a variety of real-life examples.
- Interactive Dashboard Projects: Complete 5 comprehensive projects that will challenge and enhance your skills.
Step-by-Step Learning Journey
- Power BI Desktop and Query Editor: Learn how to effectively use these tools for data analysis and visualization.
- Create Relationships: Understand how to establish relationships between different data sources in Power BI.
- Data Modeling with M Language & DAX: Master the creation of custom measures using the M Language and DAX Formula language.
- Powerful Reports and Dashboards: Learn to build interactive reports and dashboards with advanced features like drill throughs and relative date filters.
- Enhance Your Visuals: Utilize themes and custom visualizations to create compelling and professional-looking reports.
Conclusion
By the end of this comprehensive course, you will be well-equipped to harness the full potential of Power BI and turn data into actionable business intelligence insights. 🚀
Ready to Embark on Your Data Analysis Journey?
🎓 Join Us Today
Take the first step towards mastering Power BI and transforming your ability to analyze and visualize data. Let's embark on this learning adventure together! 🎉
Course Gallery
Loading charts...