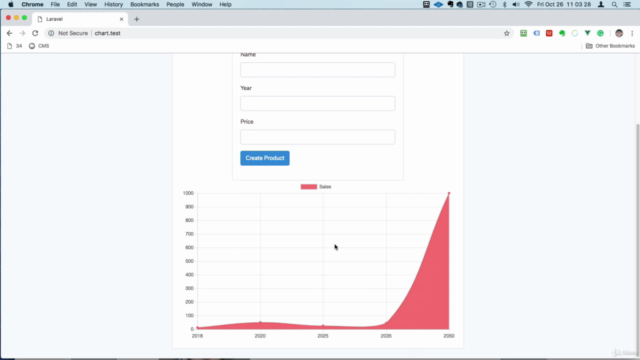
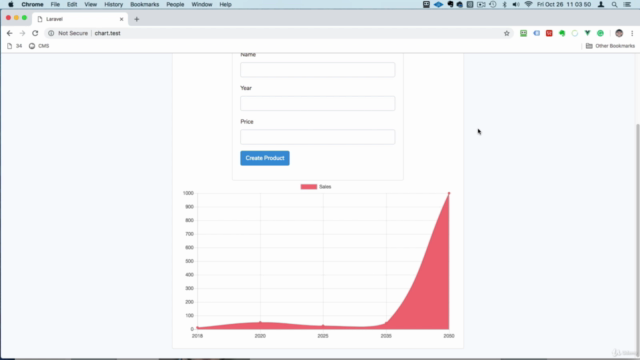
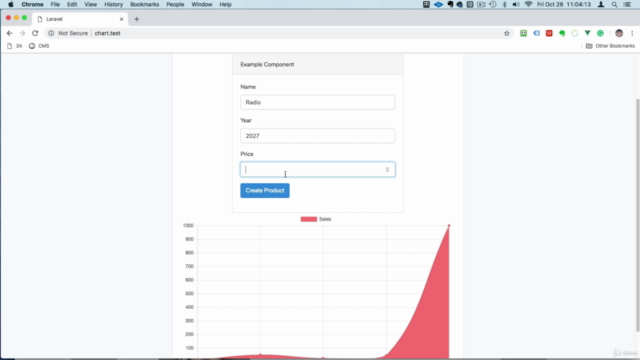
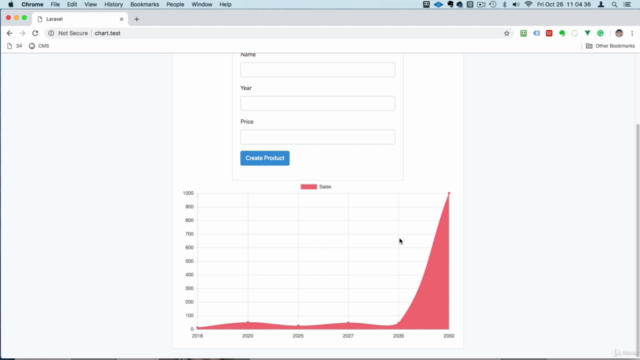
Laravel - Learn How to Create Charts with Vue.js and Laravel

Why take this course?
Course Title: Vue & Laravel Charts The Easy Way
Course Description:
Are you ready to harness the power of Vue.js and Laravel to create dynamic and interactive charts for your web applications? Whether you're a developer looking to expand your skill set or a data enthusiast eager to visualize your data in a more engaging way, this course is your gateway to mastering chart creation with these two powerful technologies.
🎓 Course Overview:
In this comprehensive and concise course, you'll learn the ins and outs of integrating charts into your Laravel applications using Vue.js. By the end of this course, you'll be equipped with the knowledge to:
- Understand Chart Concepts: Learn about different types of charts and their use cases.
- Vue.js Fundamentals for Charts: Get familiar with the basics of Vue.js that are essential for creating charts.
- Laravel API Creation: Set up a Laravel backend to handle chart data, learn how to send and receive requests from your Vue.js frontend.
- Data Visualization: Transform raw data into meaningful visual representations that are both informative and aesthetically pleasing.
- Interactive Charts: Enhance user interaction with your charts by implementing dynamic features such as tooltips, zooming, and panning.
🔍 What You'll Learn:
- Setting up the Development Environment: Get started with the necessary tools and libraries for Vue.js and Laravel development.
- Creating a Vue.js Chart Component: Dive into coding your first chart component in Vue.js, learning best practices along the way.
- Fetching Data from Laravel API: Learn how to send HTTP requests from Vue.js to your Laravel backend and process the returned data.
- Styling Your Charts: Add custom styles to your charts to make them visually appealing and tailored to your application's design.
- Advanced Chart Features: Explore advanced features such as responsive scaling, animations, and custom tooltips/legends for a rich user experience.
🚀 Why Take This Course?
- Real-World Application: Apply what you learn directly to your projects, enhancing your portfolio with modern and responsive charts.
- Hands-On Learning: Engage in practical exercises that solidify your understanding of Vue.js and Laravel chart integration.
- Step-by-Step Guidance: Follow along with clear, concise instructions and video tutorials from instructor Edwin Diaz, who brings years of experience in web development and data visualization.
📅 Course Schedule:
This course is designed to be consumed at your own pace, with a structured curriculum that will guide you through each step of the process. From setting up your initial environment to deploying your first interactive chart, this course is structured to ensure you gain practical experience and confidence in your newfound skills.
👨💻 Who Is This Course For?
- Aspiring and experienced web developers who wish to add data visualization skills to their repertoire.
- Developers familiar with Vue.js or Laravel looking to integrate charting capabilities into their applications.
- Data analysts or scientists who want to present their findings in a more interactive way on the web.
Ready to transform your data into stunning charts and graphs? Enroll in "Vue & Laravel Charts The Easy Way" today and take the first step towards becoming a data visualization expert! 🚀📊
Course Gallery


Loading charts...