JMP Training for Statistics & Data Visualization

Why take this course?
🎓 Course Title: JMP Training for Statistics & Data Visualization
🎥 Led by Expert Instructor: Brandon Fiorucci
🚀 Course Headline: Master Statistics, Analytics & Data Visualization with JMP Statistical Software!
Unlock the Power of Data with JMP 15 📊✨
Dive into the world of data analysis and visualization with our comprehensive JMP Training course. Whether you're looking to solve complex problems, uncover hidden opportunities, or inform critical business decisions, this course will equip you with the skills needed to analyze data like a pro using JMP 15.
What You'll Learn:
🧐 Summary of Topics Covered:
- Hypothesis Testing 🤔
- Normal Distributions
- Shapiro Wilk Test
- Z Test & T Test
- 2 Sample T Test
- ANOVA 🧪
- One Way ANOVA
- ANOVA T Test & Tukey Test
- Data Visualization 🎨
- Bar Charts, Pie Charts, Scatter Plots, and more!
- Descriptive Statistics 📈
- Quality Control Charts 🔧
- Pareto, X Bar & R, IMR Charts
- Distributions 📊
- Linear Regression 📐
- Fit Y by X, Correlation Coefficient
- Data Clean Up ⚒️
- Publish Sharable Analysis & Dashboards 🌐
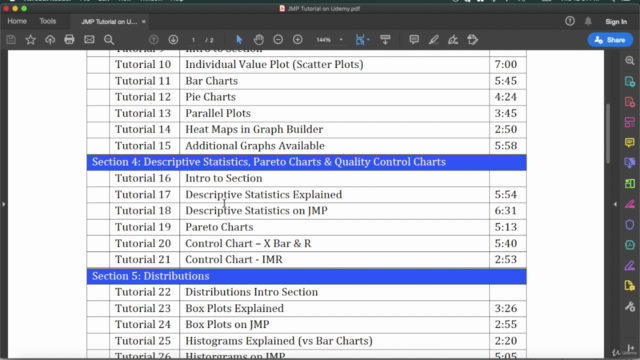
Section 2: Data Types & Column Manipulation
Master the art of importing data from various sources like Excel, Google Sheets, and CSV files. Learn how to format specific columns and clean your data effectively before diving into analysis or creating visualizations.
Section 3: JMP Visual & Graphing Mastery
Discover the power of JMP's visual and graphing capabilities. Create a wide array of charts and plots to bring your data to life, from individual value plots (scatter plots) to heat maps.
Section 4: Descriptive Statistics & Quality Control Charts
Learn to generate tables of descriptive statistics within JMP and create essential control charts like Pareto, X Bar & R, and IMR Charts.
Section 5: Distributions Overview
Get detailed insights into Box Plots and Histograms, and understand how to analyze data distributions using these powerful tools in JMP.
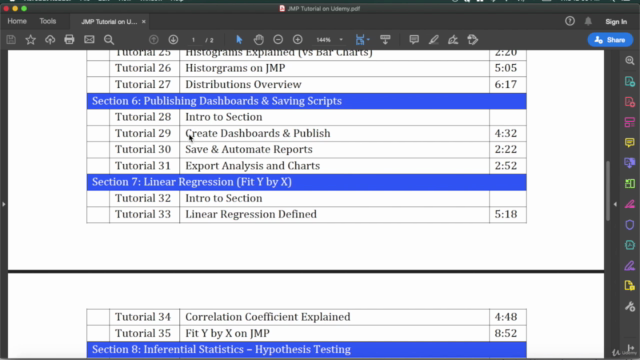
Section 6: Publish Dashboards
Share your findings by posting analysis dashboards online. Learn how to save reports for changing data, ensuring your work stays up-to-date.
Section 7: Linear Regression with Fit Y by X
Explore the concepts of dependent and independent variables through linear regression. Understand correlation coefficients and how they can predict future trends in big data.
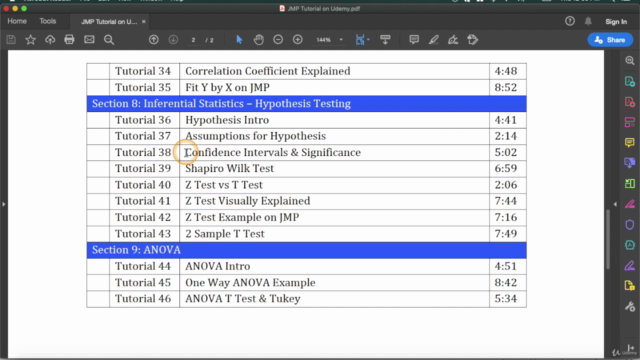
Section 8: Hypothesis Testing
Learn the fundamentals of hypothesis testing, including assumptions, confidence intervals, and significance (alphas). Test your data to see if it follows a normal distribution using the Shapiro Wilk Test, and understand Z Test and T Test through clear explanations and hands-on JMP examples.
Section 9: Advanced JMP Skills
Elevate your JMP expertise and learn advanced techniques to get the most out of this powerful software.
Course Requirements & Prerequisites:
📚 Requirements:
- A willingness to learn and dive deep into data analysis.
- Access to JMP 15 for practice (a free 30-day trial version is available from the JMP website).
Who This Course Is For:
🎓 This course is perfect for:
- Individuals new to JMP looking to learn from scratch.
- Those with existing JMP skills who want to enhance their knowledge and capabilities.
- Data analysis professionals aiming to maximize their proficiency in JMP and take full advantage of its advanced features.
Join us on this data-driven journey and transform the way you analyze and visualize data! 🌟
Don't miss out on the opportunity to become a JMP wizard and harness the power of statistical analysis and data visualization in your work or studies. Enroll now and start your journey to data mastery! 🚀
Course Gallery


Loading charts...