Introduction to Maps in R Shiny and Leaflet

Why take this course?
🚀 Introduction to Maps in R Shiny and Leaflet 🌟
Welcome, map enthusiasts and data mavens! Embark on a journey with us in the Introduction to Maps in R Shiny and Leaflet course, where we'll transform your passion for geography and data into stunning web applications.
What You Will Learn:
📊 Mastering Spatial Data: Dive into the world of spatial datasets within the R programming language. Learn to manipulate and visualize this unique type of data with precision and ease.
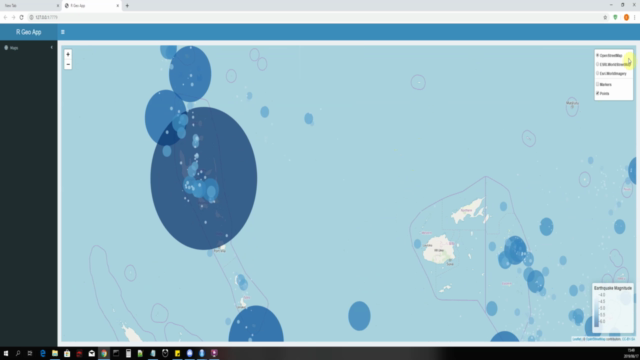
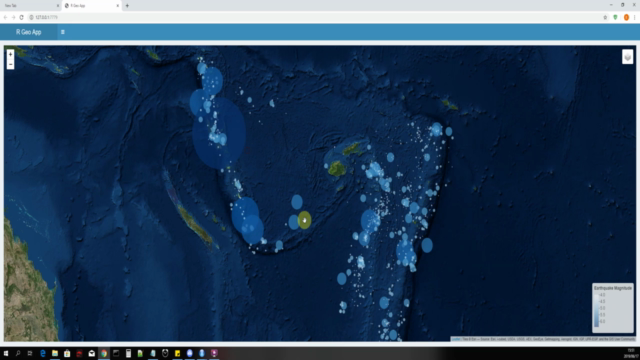
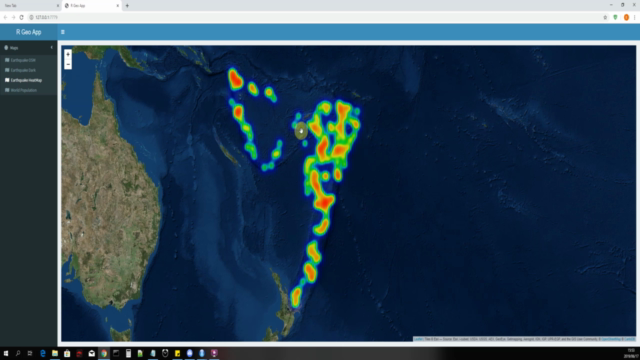
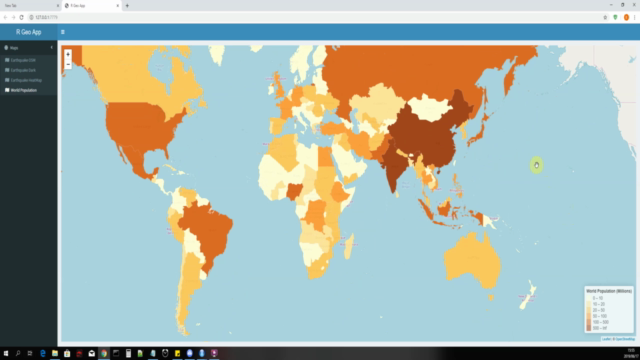
🔍 Interactive Web Mapping: Discover how to create engaging, interactive maps using the powerful Leaflet library. From basic point maps to complex heatmaps and choropleth maps, bring your spatial stories to life.
🌍 Real-World Data Applications: Utilize a variety of datasets—including dataframes and spatial dataframes—to visualize on maps tailored to specific use cases.
🛠️ R Studio Proficiency: Get hands-on experience with R Studio, one of the most popular development environments for R, and learn to leverage its features to streamline your workflow.
�ashboard Building Dashboards with R Shiny: Learn the ins and outs of creating dynamic dashboards in R Shiny that allow users to interact with and explore data through beautiful, responsive maps.
🎨 Map Aesthetics & Customization: Craft visually appealing maps by creating custom legends and utilizing a wide range of color palettes. Enhance your maps with HTML embedding for even greater stylistic control.
📊 Dataframes & R Terminal Operations: Gain proficiency in handling dataframes within R, and learn to execute terminal commands that will further expand the capabilities of your applications.
Course Outline:
-
Understanding Spatial Data: Learn how to handle spatial dataframes and visualize geographic information using R.
-
Setting Up Your Development Environment: Get started with R Studio, which will be your workspace for building and testing map applications.
-
Introduction to Leaflet: Understand the basics of the Leaflet library and how it integrates with R Shiny.
-
Creating Your First Map: Learn to create a basic point map and understand the underlying R code that makes it work.
-
Advanced Mapping Techniques: Explore more complex types of maps, such as heatmaps and choropleth maps, and learn how to effectively visualize spatial data.
-
Building Interactive Dashboards: Step-by-step guidance on creating interactive Shiny dashboards that display your maps with user inputs and controls.
-
Customizing Maps: Learn how to add custom styles, legends, and HTML elements to enhance the look and feel of your web applications.
-
Best Practices for Deployment: Tips and tricks for deploying your web map applications so they can be accessed by anyone around the globe.
By the end of this course, you'll be equipped with the tools and knowledge necessary to build sophisticated, professional-grade web mapping applications. You'll be able to tell compelling data stories that are accessible and interpretable for a wide audience.
📅 Start Your Mapping Journey Today! 📤
Enroll in this course and unlock your potential as a mapmaker, analyst, or storyteller with data. Whether you're a beginner or looking to expand your skillset, this course will guide you through the process of building and deploying maps that will stand out in any project. 🌍💻
Course Gallery


Loading charts...