Introduction to Data Analytics with Microsoft Excel

Why take this course?
🎓 Master Data Analysis through Excel with Advanced Hands-On Practical Training
Course Requirements 📚
Course Description 🧮
Welcome to the exciting and ever-evolving field of Data Analytics! Voted as the sexiest job of the 21st Century, data analytics is at the heart of every strategic business decision. In this comprehensive course, we will introduce you to the world of data analytics through the powerful lens of Microsoft Excel.
You'll learn not only the concepts behind data analysis but also how to turn raw data into actionable insights and compelling stories. Whether you're a beginner or an experienced user looking to refine your skills, this course is designed to guide you step by step through advanced analytical techniques using real-world datasets, templates, and 17 hands-on practical activities.
Look at this as the first step in becoming a fully-fledged Data Scientist! 🚀
Course Outline 🗺️
This course is meticulously structured to cover each topic in detail, ensuring you gain a deep understanding of data analytics with Excel. Here's a sneak peek into what you'll explore:
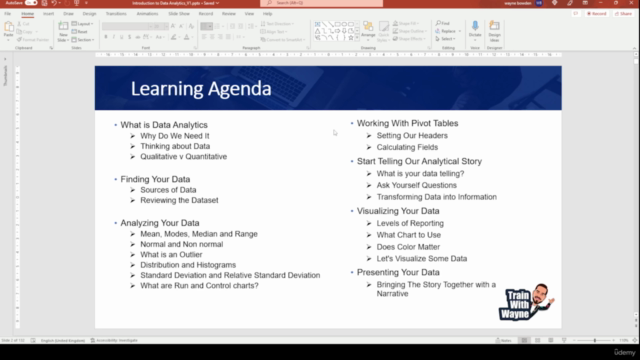
What is Data Analytics?
- Why Do We Need It in This New World? 🤔
- Thinking About Data: In Theory vs. In Practice 📈
- Qualitative vs. Quantitative Data: The Yin and Yang of Analytics 🧐
Finding Your Data
- Sources of Data: Where to Dig 🛠️
- Understanding the Landscape of Available Data 🌍
Data Exploration with Excel
- Mean, Mode, Median, and Range: The Basics of Descriptive Stats 📊
- Distribution and Histograms: Visualizing Your Data 📈
- Normality Testing: Is Your Data Typical? 🤓
Advanced Data Analysis Techniques
- Standard Deviation and Relative Standard Deviation: Understanding Variability 🔍
- Run Charts and Control Charts: Tracking Changes Over Time ⏰
- Data Engineering: QCD (Quality, Cost, and Delivery) Analysis 💡
Practical Activities
- A series of hands-on exercises designed to reinforce learning and apply analytical skills in real scenarios. 👨🏫🔧
Who this course is for: 🎫
- Anyone who uses Excel regularly and wants to elevate their data analysis capabilities
- Excel users with basic skills seeking to enhance their proficiency in data exploration and analysis
- Students aiming for a comprehensive, engaging, and highly interactive learning experience
- Individuals aspiring to enter the fields of data analysis or business intelligence
Embark on your journey to becoming an expert in data analytics with Excel. Enroll in this course today and unlock the power of data to make informed decisions, drive business success, and tell compelling stories through numbers! 📊✨
Course Gallery


Loading charts...