Introduction to Data Analysis Using Excel for Researchers

Why take this course?
🎓 Course Title: Introduction to Data Analysis Using Excel for Researchers
🚀 Headline: Introductory Course on How to Use Excel Skills to Prepare and Analyze Data for Research or Other Purposes
🔍 Why Take This Course? Excel is indispensable in the modern world of data analysis. With its ability to handle large datasets and provide insightful visualizations, it's no wonder that Excel skills are highly sought after across various industries. Whether you're a researcher looking to validate your hypothesis or a professional aiming to leverage data in decision-making, this course will equip you with the tools to transform raw data into meaningful insights.
📊 Course Description:
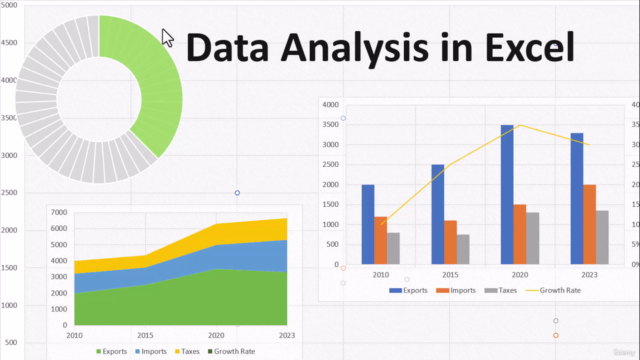
Build Strong Excel Skills Excel has evolved to become a powerhouse in data analysis. It's not just about crunching numbers; it's about understanding the narrative behind those numbers. In this course, you'll learn how to tap into Excel's full potential, analyze complex datasets, and create compelling visualizations that can influence decisions at every level of an organization.
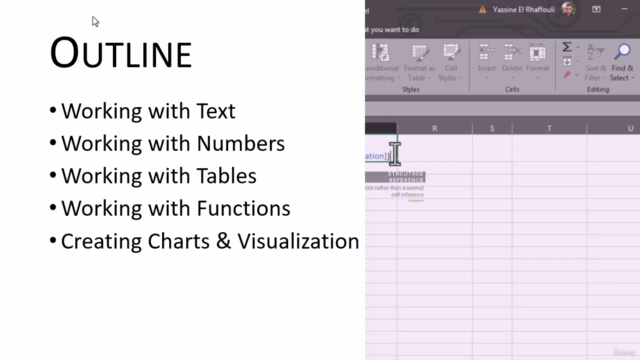
- Master Excel Basics: Get comfortable with the interface, data manipulation, and basic analysis before diving into advanced techniques.
- Data Analysis Steps: Learn a systematic approach to data analysis that can be applied to any dataset or project.
- Real-World Data Application: Apply your skills to analyze actual datasets, gaining valuable insights that reflect real-world scenarios.
Practice Using Excel with Practical Datasets This course isn't just theoretical; you'll get hands-on experience with practical datasets that are representative of real-life research and business applications. You'll learn to:
- Navigate Your Worksheet: Understand how to manage large datasets efficiently within Excel.
- Trim and Classify Data Types: Learn to prepare your data by categorizing it effectively for analysis.
- Analyze Successful Projects: Discover what makes certain projects more successful than others through data-driven insights.
Learn How to Use VLOOKUP The VLOOKUP function is a cornerstone in Excel, allowing you to query large datasets and retrieve specific information with ease. In this section, you'll:
- Extract Text and Prepare Date Data: Master the art of text manipulation and date formatting to ensure your data is ready for analysis.
- Prepare Data for Combining: Learn how to align and consolidate data from various sources to create a comprehensive dataset.
- Apply Excel Functions and Shortcuts: Utilize time-saving functions and keyboard shortcuts that will speed up your data analysis workflow.
🌍 Skill Applicability Across Industries The skills you'll acquire in this course transcend beyond research; they are applicable to any sector where data plays a crucial role, including:
- Data Analysis: Gain a deeper understanding of statistical tools and techniques for interpreting data.
- Marketing: Use Excel to track campaigns, analyze consumer behavior, and measure marketing ROI.
- Finance: Streamline financial reporting, budgeting, and forecasting with powerful Excel features.
- HR: Analyze employee data, performance metrics, and manage workforce planning more effectively.
- Logistics: Optimize supply chain management by analyzing inventory levels, delivery times, and other critical logistic factors.
By the end of this course, you'll be confident in your ability to handle complex datasets with Excel, extracting valuable insights that can drive strategic decision-making within your research or industry domain. 📈🚀
Enroll now and take the first step towards mastering data analysis with Excel!
Course Gallery


Loading charts...