Interactive Microsoft Excel Dashboard for Data Analyst

Why take this course?
🚀 Course Title: Interactive Microsoft Excel Dashboard for Data Analyst 2023 📊
🎉 Course Headline: Master the Art of Interactive Excel Dashboards with Just ONE CLICK! 🚀
Unlock Your Potential in Data Analytics 🎓
This course is a game-changer for anyone looking to master data analytics and dashboard creation. As your instructor, Ismaila Omeiza Mumuni, I bring years of experience as an analyst, freelancer in data analytics, and now, your guide through the complexities of Excel. My goal is to empower you with the skills to transform raw data into actionable insights using interactive dashboards.
Why This Course? 🌟
- Real-life Datasets: We use datasets that mirror real-world business scenarios and industry standards.
- Comprehensive Learning: With more projects than any other instructor on this platform, you'll be immersed in practical learning experiences.
- Exceptional Designs: Not only will your dashboards be dynamic and interactive, but they'll also boast exceptional designs that captivate and engage.
- Monetize Your Skills: Learn how to leverage your newfound skills to offer valuable data analytics services and monetize your expertise.
Course Highlights: 🎯
- Power Query Mastery: Learn to clean and transform data efficiently with Power Query.
- Power Pivot Proficiency: Handle massive datasets with ease using Power Pivot. Analyze millions of rows of data right within Excel!
- DAX Language Skills: Manipulate and analyze your data with the powerful DAX language, creating robust relationships between multiple tables without the hassle of slow lookups.
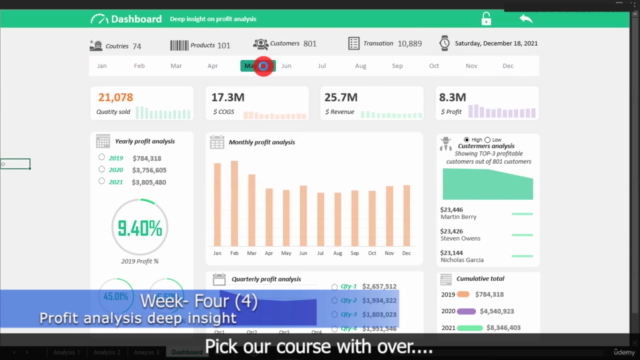
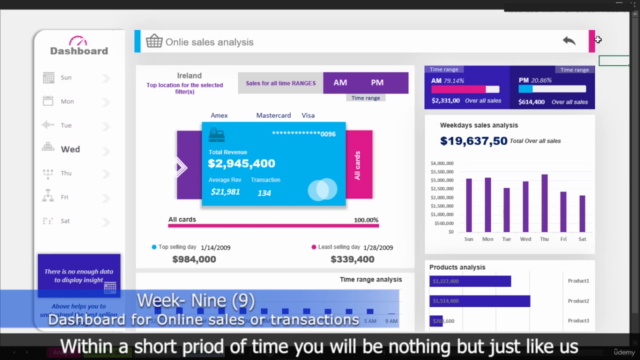
- Interactive Dashboards: Build dashboards that update with just one click, providing real-time insights and data visualization capabilities.
What You Will Learn: 📈
- How to create interactive dashboards from scratch.
- Techniques for handling large datasets with Power Pivot.
- The art of data cleaning and transformation with Power Query.
- How to use the DAX language to manipulate data and create relationships between tables.
- Best practices for designing dashboards that are both functional and aesthetically pleasing.
Join Us Today! 🤝 Embark on a journey to become a proficient data analyst and dashboard designer with practical, real-world skills that you can apply immediately. Whether you're looking to enhance your resume, pivot your career, or start a new venture in data analytics, this course is your stepping stone to success.
Don't Miss Out! 🎬 Enroll now and create stories with data that lead businesses to make informed decisions. With Interactive Microsoft Excel Dashboard for Data Analyst 2023, you'll be at the forefront of data analytics, armed with the knowledge and skills to turn datasets into strategic assets.
Sign Up Now and Elevate Your Data Analytics Game! 🛣️✨
Course Gallery


Loading charts...