Microsoft Excel Training - Interactive Dashboards

Why take this course?
🎉 Microsoft Excel Training - Master Interactive Dashboard Creation! GroupLayout your data like a pro with our Exclusive Excel Course designed to turn you into an expert in creating dynamic and interactive charts and dashboard designs. Whether you're a business analyst, a data enthusiast, or simply looking to elevate your spreadsheet skills, this course is tailored for YOU. 📊✨
Course Overview:
🚀 What You'll Learn:
- Hands-On Excel Mastery: Dive into creating interactive charts and stunning dashboards with real-world exercises that make learning practical and effective.
- Customizable Chart Creation: Step-by-step guidance on transforming your data into engaging visuals through custom charts tailored to your needs.
- Effortless Report Generation: Learn how to generate comprehensive reports within Excel, enhancing your ability to present data with impact and clarity.
🛠️ What You'll Get:
- A comprehensive Course Workbook that will serve as your roadmap to mastery.
- A Sample Dashboard to practice and perfect your skills.
- A detailed Step-by-Step Guide within the sample workbook, ensuring you understand the intricacies of creating interactive and dynamic charts in Excel.
Course Structure:
- Chart Fundamentals: Learn the nuts and bolts of chart creation in Excel - understanding data types, selecting the right chart type, and setting up your first chart.
- Chart Formatting Mastery: Tips and tricks to format your charts professionally, ensuring they are visually appealing and easy to understand.
- Form Controls: Discover how to add interactivity to your charts with Excel form controls, transforming static visuals into dynamic tools.
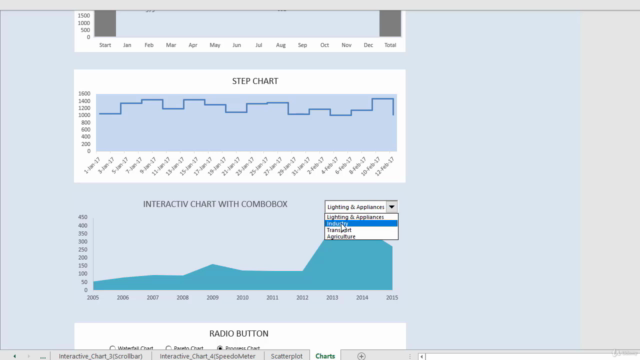
- Interactive Charts: Unleash the full potential of your charts by making them interactive - learn how user interactions can change data presentation on the fly.
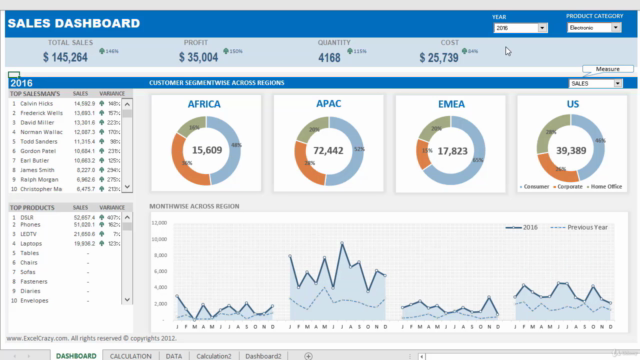
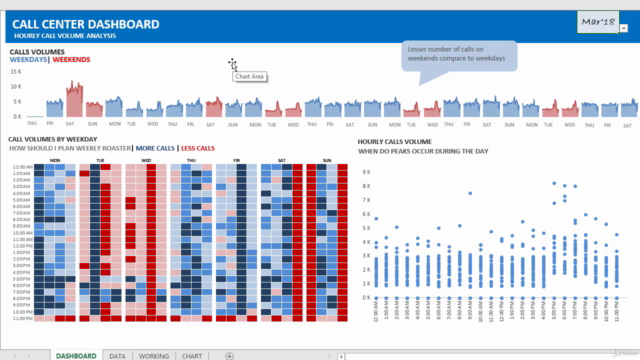
- Dashboard Design: Craft beautiful and functional dashboards using best practices in design and interactivity, turning raw data into actionable insights.
Why You Should Enroll:
- In-Demand Skills: Stay ahead of the curve by learning skills that are highly sought after in today's data-driven world.
- Career Advancement: Elevate your career with advanced Excel skills, making you an indispensable asset to any team.
- Real-World Application: Apply what you learn directly to your job, enhancing your efficiency and the value you bring to your organization.
Don't miss out on this opportunity to transform your Excel skills! 🚀📚
Enroll now and start your journey towards becoming an Excel Dashboard Wizard!
Note: This course is designed for intermediate users of Excel who have a basic understanding of the software. By the end of this course, you will not only be able to create interactive dashboards but also present your data in a way that will captivate and inform your audience.
Sign up today and take the first step towards becoming an Excel expert! 💻🎉
Course Gallery


Loading charts...