Inkscape for Scientists and Engineers

Why take this course?
🎓 Master Inkscape for Scientific Diagrams: A Comprehensive Guide for Scientists & Engineers
Course Title: Inkscape for Scientists and Engineers
Course Description:
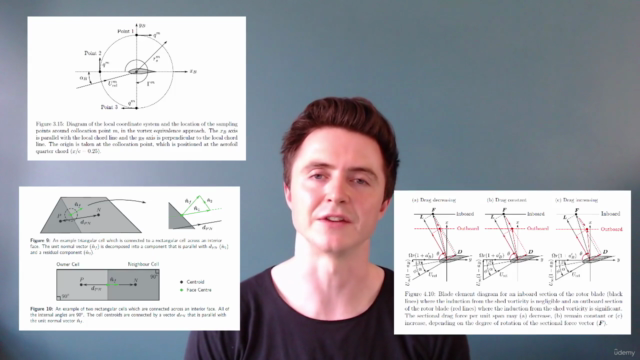
Unlock the full potential of your academic and professional documents with Inkscape for Scientists and Engineers! Taught by the esteemed Dr. Aidan Wimshurst, this online course is a game-changer for students and professionals across science, engineering, and mathematics. Say goodbye to bland graphs and diagrams; it's time to elevate your work to stand out in the crowded field of research.
Why Take This Course?
📊 Enhance Your Documents: Learn the secrets to producing graphs and diagrams that are not only informative but also visually stunning.
✨ Industry-Specific Focus: Tailored exclusively for scientists, engineers, and mathematicians—not graphic designers.
🧩 Step-by-Step Guidance: From installing Inkscape to mastering its features, every step is laid out for you in clear, easy-to-follow instructions.
🔗 Seamless Integration: Discover how to integrate your Inkscape creations with other programs like Word, Latex, Python, MATLAB, and Excel, making the transition between data analysis and document creation smooth and efficient.
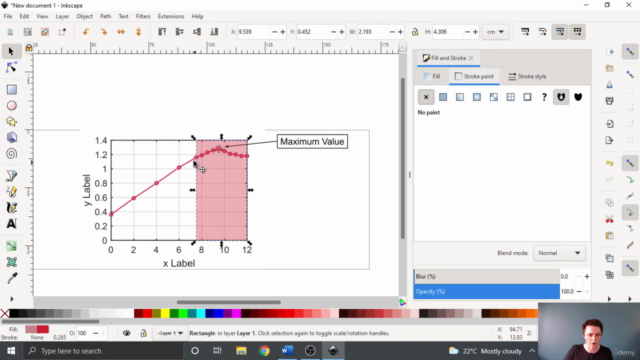
📈 Advanced Techniques: Explore the nuances of creating line plots, contour plots, and complex scientific diagrams that will make your work truly stand out.
Course Breakdown:
-
Installation & Setup: Begin with getting Inkscape installed on your system, understanding its interface, and familiarizing yourself with the basic controls.
-
Integration with Other Programs: Learn how to effortlessly move your data between spreadsheets, programming environments, and document editors.
-
Creating Scientific Diagrams: Master the art of creating diagrams that are both scientifically accurate and visually appealing.
-
Graph Combination & Enhancement: Discover techniques to combine multiple graphs into a cohesive and impactful visual narrative for your research.
What You Will Learn:
-
Basic to Advanced Features of Inkscape: From drawing basic shapes to creating complex illustrations, you'll cover it all.
-
Inkscape Extensions: Utilize powerful extensions available in Inkscape to streamline your workflow.
-
Optimizing Your Graphics: Ensure your diagrams are optimized for clarity and effectiveness without sacrificing quality.
-
Effective Communication of Data: Learn how to effectively represent data so that it is both understandable and visually engaging.
Who Is This Course For?
This course is ideal for:
-
PhD Students: Make your thesis stand out with professional graphs and diagrams.
-
Research Scientists: Communicate your findings more effectively with enhanced visual aids.
-
Engineering Professionals: Present complex data in an accessible and appealing manner.
-
Mathematics Scholars: Illustrate abstract concepts with clarity and precision.
Join Dr. Aidan Wimshurst in this journey to refine your scientific communication through the power of Inkscape. Elevate your academic and professional work with high-quality visuals that make a difference! 🖥️🎨✨
Course Gallery


Loading charts...