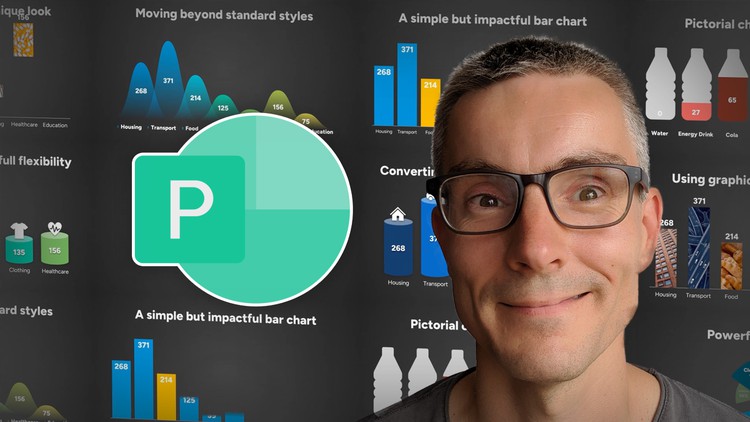
Improve Your Charts and Data Visualizations in PowerPoint

Why take this course?
📈 Make Your Presentation Stand Out with Advanced Chart & Data Visualization Techniques
Are you ready to elevate your data presentations from bland to brilliant? In the "Improve your Charts and Data Visualizations in PowerPoint" course, Alan Lomence, a seasoned presentation designer with over 20 years of PowerPoint expertise, guides you through the art of effective data visualization.
📊 Why Choose This Course? Data visualization can transform complex datasets into clear and compelling narratives. Learn to harness the power of PowerPoint's extensive chart options and master the technique of simplifying your visuals so that your audience can grasp your message with ease.
Key Features of This Course:
- Diverse Chart Types: Explore a variety of charts including bar charts, pie charts, pictorial charts, key data point charts, and proportional area charts.
- Real-Time Data Application: Work with 'live' data within PowerPoint for a hands-on learning experience that allows you to modify the data anytime.
- Design Flexibility: Discover how to convert charts into editable shapes, giving you complete creative control over your design.
- Tailored Techniques: Learn how to tailor your chart choices to best represent and emphasize your key data points.
- Elevated Aesthetics: Enhance your presentation's visual appeal with professional design principles that make your charts stand out.
What You'll Learn:
- 📉 Bar Charts: Understand how to present categorical and quantitative data side by side for an effective comparison.
- 🥧 Pie Charts: Dive into the world of percentages and proportions, making your pie charts clearer and more informative than ever before.
- 🎨 Pictorial Charts: Combine visuals with data to create a powerful connection with your audience.
- ✨ Key Data Point Charts: Highlight the most important statistics in a way that captures attention and communicates critical information effectively.
- 🔧 Proportional Area Charts: Master this often overlooked but incredibly versatile chart type, ideal for showing trends and changes over time.
Course Breakdown:
- Introduction to Data Visualization: Learn the importance of data visualization and the impact it can have on your presentation's effectiveness.
- Choosing the Right Chart Type: Get tips on selecting the most appropriate chart for your data, audience, and presentation goals.
- Enhancing Your Charts with PowerPoint Tools: Discover how to use PowerPoint's built-in features to customize your charts, including formatting text, colors, and adding elements like titles and labels.
- Converting Charts into Shapes for Advanced Design: Step-by-step guidance on turning your charts into fully editable shapes, unlocking a new realm of design possibilities.
- Finalizing Your Presentation: Learn how to add the finishing touches to your presentation, ensuring that your data visualizations are both professional and impactful.
Join Alan Lomence in this comprehensive course and turn your PowerPoint presentations into works of data visualization art. Whether you're a business analyst, marketer, educator, or just someone who wants to look like one, this course will give you the skills to make your data not just understood, but appreciated. 🚀
Sign up now and transform the way you present data forever! 🌟
Course Gallery


Loading charts...