How to Visualize Data with R

Why take this course?
📊 How to Visualize Data with R: Master Data Storytelling through Real Weather Data 🌤️
Dive into the world of data visualization and storytelling with our comprehensive online course, "How to Visualize Data with R", led by the expert tutelage of Elisabeth Robson. This course is designed for learners of all levels who aspire to transform raw data into compelling visual narratives using the powerful R programming language.
🎓 What You'll Learn:
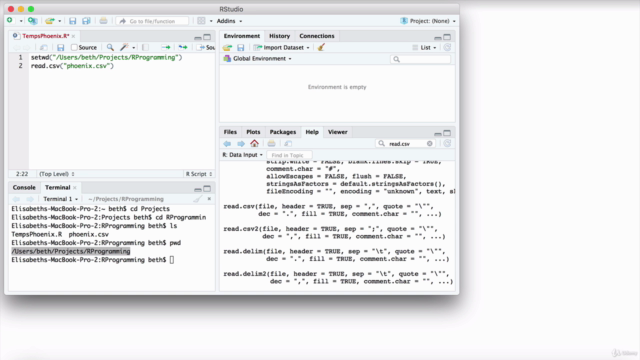
- Foundations of R and RStudio: Get acquainted with the R environment and RStudio, learning how to navigate and write your first scripts.
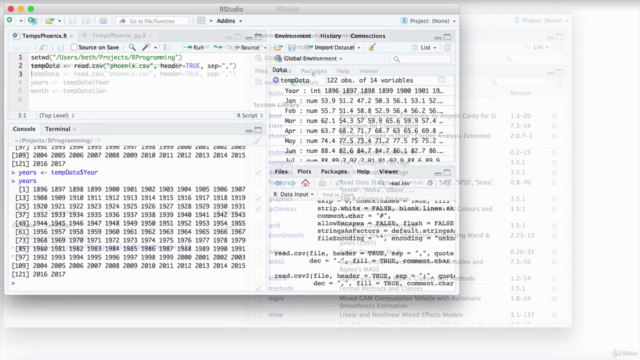
- Data Handling in R: Master reading data from CSV files, manipulating datasets, and understanding the structure of data frames within R.
- Data Inspection: Learn to inspect data for quality, consistency, and trends to ensure accurate visualizations.
- Visualization Techniques: Gain hands-on experience with both the
plot()function for basic plots and theggplot2package (ggplot()) for advanced and more customizable visualizations. - Data Storytelling: Discover how to tell a story through your data, making your findings accessible and engaging to any audience.
🔹 Key Course Highlights:
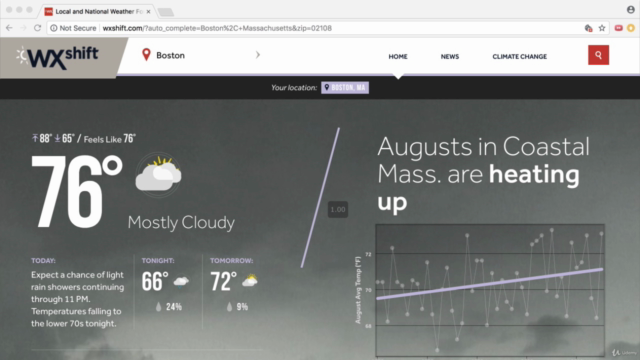
- Real-World Application: Work with actual weather dataset from the US National Weather Service.
- Interactive Learning: Engage with real code examples and exercises tailored to help you visualize data effectively.
- Statistical Insights: Explore concepts like linear regression and its role in data analysis and visualization.
- Package Installation: Learn how to install and use R packages to enhance your data visualization capabilities.
📚 Course Structure:
- Introduction to R and RStudio: Get comfortable with the R programming environment.
- Data Importing and Handling: Learn to import data from CSV files and handle datasets within R.
- Exploratory Data Analysis (EDA): Understand your dataset by exploring, visualizing, and analyzing it.
- Basic Plotting in R: Create scatter plots and other basic graphs to represent your data.
- Advanced Visualization with ggplot2: Utilize the
ggplot2package to create more complex and sophisticated visualizations. - Data Storytelling: Craft a narrative around the weather data, learning how to convey insights in a clear and compelling manner.
- Final Project: Apply all you've learned to visualize a dataset from the US National Weather Service.
🎯 By the end of this course, you will:
- Have a solid understanding of R for data analysis and visualization.
- Know how to use
plot()andggplot2to create clear and insightful plots. - Be equipped with the skills to analyze weather datasets and visualize key findings.
- Have developed a portfolio piece that demonstrates your ability to handle real data and present it effectively.
👩🏫 Your Instructor: Elisabeth Robson Elisabeth Robson is an experienced data scientist and educator with a passion for teaching the nuances of R programming. Her expertise in data visualization will guide you through each step of this course, ensuring you leave with the confidence to tackle any dataset.
📆 Enroll Now Embark on your journey to becoming a data visualization expert with "How to Visualize Data with R". Sign up today and transform the way you work with data!
Course Gallery


Loading charts...