How to Visualize Data with JavaScript

Why take this course?
📊 Master Data Visualization with JavaScript: A Hands-On Course with Elisabeth Robson
🚀 Course Title: How to Visualize Data with JavaScript
🌍 Course Headline: Visualize Trends in Temperature Data with HTML, CSS, JavaScript, and jQuery
Embark on a Journey into Data Visualization 🎨✨
Welcome to the exciting world of How to Visualize Data with JavaScript! In this comprehensive online course, you'll embark on a project to turn your web skills up a notch by learning to visualize data in innovative ways. With the guidance of expert instructor Elisabeth Robson, you'll explore the power of HTML, CSS, and JavaScript to create engaging data visualizations that can make a real impact.
What You'll Discover:
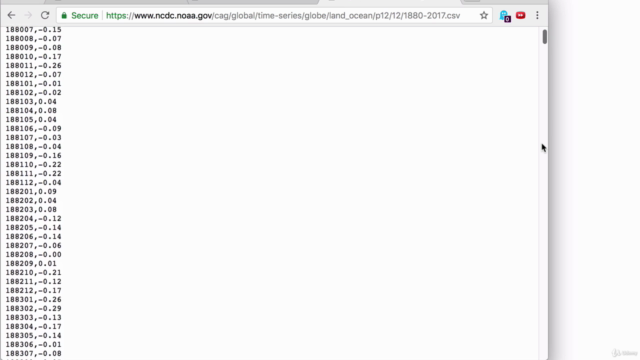
- Downloading Data from NOAA: Learn how to source real-world temperature data from the National Oceanic and Atmospheric Administration (NOAA) and integrate it into your visualizations.
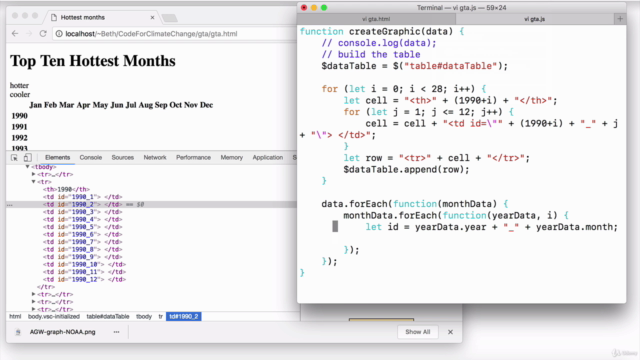
- Reading Data with JavaScript: Dive into the basics of reading data files and manipulating them using JavaScript, transforming raw data into a structured format for easy handling.
- Data Presentation: Present your data in an HTML table, enhancing readability and organization.
- Color Coding for Clarity: Add vibrant colors to your visualization with CSS, making the data more accessible and visually appealing.
- Enhanced Interactivity with jQuery: Utilize jQuery plugins to streamline the process of selecting and updating elements within your page, adding a touch of interactivity to your visualization.
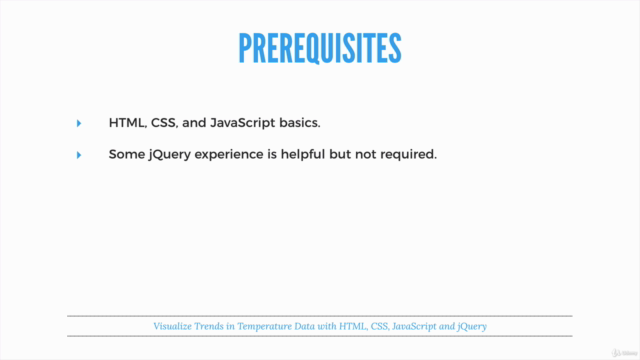
🛠️ Pre-requisites: To navigate through this course successfully, you should have a solid understanding of:
- HTML: The markup language used for creating web pages.
- CSS: The style sheet language used to describe the presentation of a document written in HTML.
- JavaScript: Basic programming skills and familiarity with JavaScript, the scripting language that enables dynamic content on websites.
🛣️ Learning Path: Follow this structured learning path for optimal understanding:
- Head First HTML & CSS: Gain a solid foundation in web design with this approachable guide.
- Head First JavaScript Programming (Chapters 1-6): Build your JavaScript skills from the ground up, focusing on the fundamentals.
- How jQuery Works: The Basics: Learn the essentials of jQuery, a fast, small, and feature-rich JavaScript library that makes things like HTML document traversal and manipulation, event handling, and animation much simpler with an easy-to-use API that works across a multitude of browsers.
- This Course: How to Visualize Data with JavaScript: Put your skills into practice by creating interactive data visualizations.
By the end of this course, you'll have transformed raw temperature data into compelling visual stories, demonstrating your newfound expertise in data visualization. Ready to elevate your web development skills and present data in a way that tells a story? Enroll now and let's turn your data into a masterpiece! 🎨📈
Join us and unlock the power of data visualization with JavaScript, HTML, CSS, and jQuery. Let's make data come alive on the web! 🚀🌐
Course Gallery


Loading charts...