How to Process Time Series Data with JavaScript

Why take this course?
🚀 Master Time Series Data with JavaScript & D3.js: Visualize COVID19 with Elisabeth Robson!
🔍 Dive into the World of Data Visualization
Are you ready to transform raw data into compelling, interactive visualizations? In this comprehensive online course, "How to Process Time Series Data with JavaScript", led by the expert instructor, Elisabeth Robson, you'll embark on a journey to understand and represent complex datasets, specifically focusing on global COVID19 data.
Course Highlights:
- 📊 Hands-On Learning: Work with real-time data from Johns Hopkins University to create your own data visualization project.
- 🌍 Real-World Application: Engage with a dataset that has immediate relevance and impact, helping you and others grasp the magnitude of the pandemic.
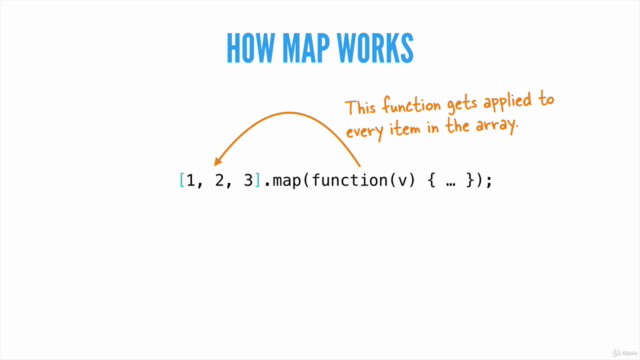
- 🔋 Skill Development: Enhance your JavaScript skills, particularly around map and filter methods, and become proficient with D3.js's powerful scale functions.
- 🤝 Community Impact: Contribute to public understanding of the global situation by presenting your data in an accessible format.
What You Will Learn:
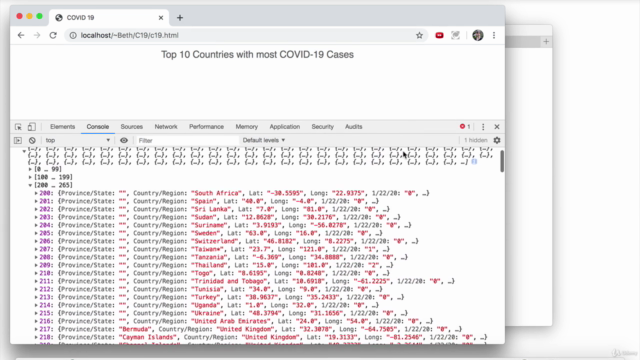
- Data Processing: Learn how to clean, process, and prepare time series data for visualization using JavaScript's built-in methods.
- Structuring Data for Visualization: Understand how to structure your data in a way that is conducive to creating meaningful visual representations.
- D3.js Techniques: Get hands-on experience with D3.js, including setting up your project environment, working with SVG elements, and implementing scale functions like linear, time, and ordinal scales.
- Creating Interactive Visualizations: Build dynamic and interactive data visualizations that allow users to explore the data in more depth.
Course Structure:
- 🌱 Introduction to Time Series Data: Understanding what it is and why it's crucial for data analysis.
- 🛠️ Setting Up Your Development Environment: Get started with all the necessary tools and libraries, including D3.js.
- 📈 Data Visualization Basics: Learn the principles of data visualization and how to choose the right type of chart for your data.
- ⚛️ Processing Data with JavaScript: Master the map, filter, and other JavaScript functions to manipulate your dataset effectively.
- 📊 D3.js Deep Dive: Explore advanced D3.js concepts like scales, axes, and data binding.
- 🚀 Building Your Visualization: From concept to completion, create a visualization of the COVID19 data that's both informative and engaging.
- 🔄 Interactive Features: Add interactivity to your visualization to allow users to explore different aspects of the data.
- 🎉 Final Project: Tie together everything you've learned to build a complete, functional data visualization project.
- 🤝 Community Feedback and Improvement: Share your work with peers for feedback and iterate on your project to enhance its clarity and impact.
Whether you're a budding data scientist, a front-end developer looking to expand your skill set, or just someone passionate about data visualization, this course will equip you with the knowledge and tools to turn complex datasets into understandable and engaging stories.
Join Elisabeth Robson in this insightful journey and become a proficient data visualizer with JavaScript and D3.js! 🌐💡
Enroll now and start transforming data into insights!
Course Gallery


Loading charts...