Excel Charts & Graphs and SmartArt Graphics for Beginners
Why take this course?
🌟 Master Excel Charts & Graphs with Ease! 🌟
Course Overview:
Excel is an indispensable tool in today's data-driven world, and mastering its charting capabilities can transform the way you analyze and present data. "Excel Charts & Graphs and SmartArt Graphics for Beginners" by Kawser Ahmed is designed to take you from a novice to an Excel pro in data visualization.
Why Take This Course? 📈
- Teaching Excellence: Kawser Ahmed has taught 11 courses on Excel and Data Analysis, reaching over 375 reviews and 15,000+ successful students since 2015.
- Popularity: With more than 25,000 visitors monthly to his blog, ExcelDemy dot com, Kawser's expertise is recognized by a wide audience.
- Course Up-to-Date: The course content has been recently updated on Nov 01, 2016, ensuring you learn the latest techniques in data visualization.
Course Highlights:
-
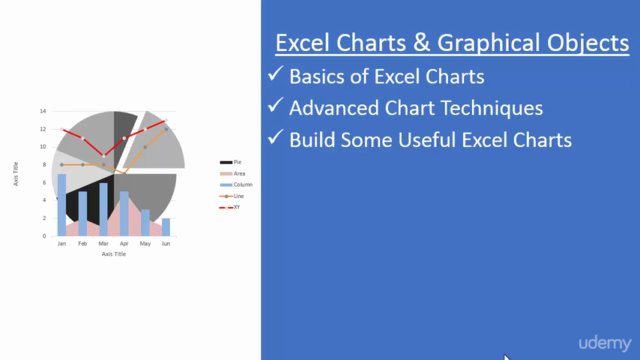
Basics of Excel Charts: Understand the foundation of creating and selecting appropriate chart types for your data.
-
Advanced Chart Techniques: Learn to navigate and utilize advanced tools within Excel's task panes to refine your charts.
Key Charts You Will Build:
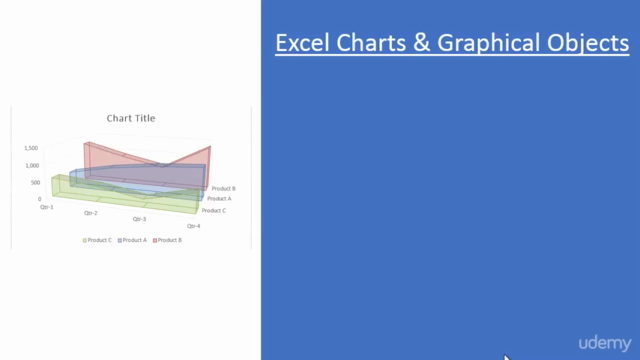
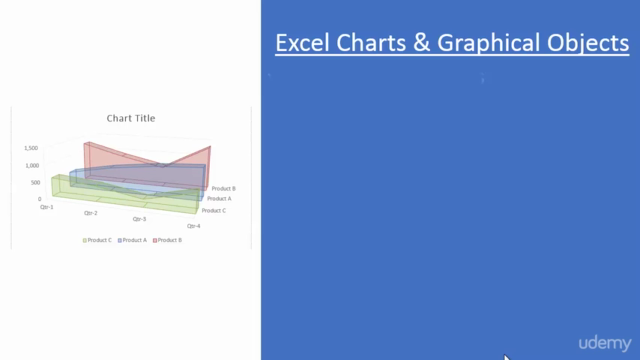
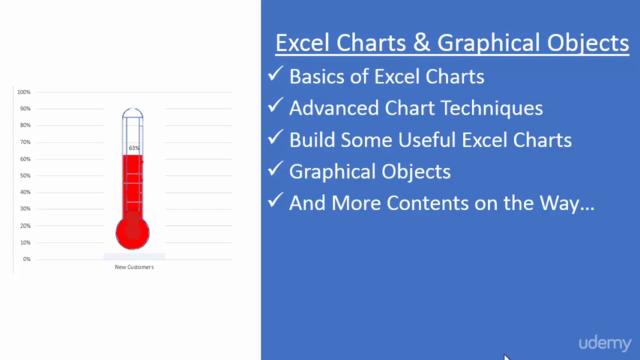
✅ Combo Chart: Combining multiple data series on the same chart. ✅ Picture Chart: Embedding pictures into your charts for a more engaging visual. ✅ Thermometer Chart: A dynamic and motivating way to track progress toward a goal. ✅ Gauge Chart: Analyzing performance against certain benchmarks. ✅ Comparative Chart: Visualizing comparisons between different sets of data. ✅ Gantt Chart: Managing projects effectively with timeline visualizations.
- Graphical Objects: Explore the use of graphical objects to enhance your presentations and make complex data more digestible for an audience.
Continuous Learning:
This course is a living resource, with Kawser regularly adding more lectures to cover real-life scenarios in data visualization using Excel Charts and Graphical Objects.
Your Learning Journey:
By the end of this comprehensive course, you will be equipped with the skills to create impactful charts and graphs that can be applied to your daily work. You'll learn how to:
- Design and implement charts effectively.
- Choose the appropriate chart types for different sets of data.
- Utilize graphical objects to support your data presentations.
Join us now and transform your approach to data analysis and visualization with Excel! 🎉
Don't miss out on this opportunity to enhance your data presentation skills. Sign up today and start visualizing your data like a pro!
Course Gallery
Loading charts...