Histograms and S-curves using Excel charts

Why take this course?
🚀 Master Histograms and S-curves for Effective Planning with Excel! 📈🔧
Welcome to "Histograms and S-curves for Planning" – your comprehensive guide to harnessing the power of Microsoft Excel for data visualization and project planning. In this course, Ahmed Mahmoud Mohammed Abd Elgalil will lead you through the essentials of creating powerful histograms and S-curves that are vital for any project manager or analyst.
Course Overview:
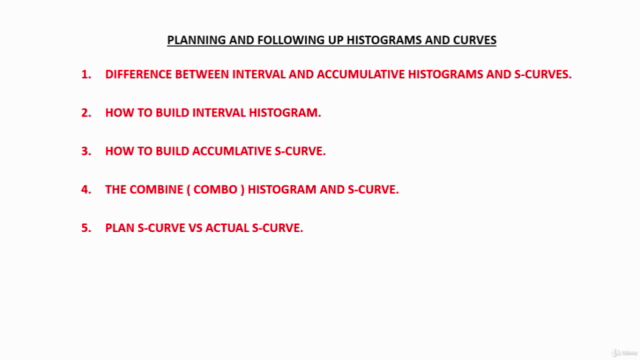
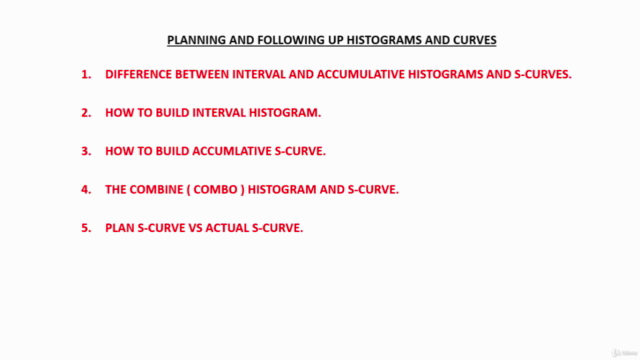
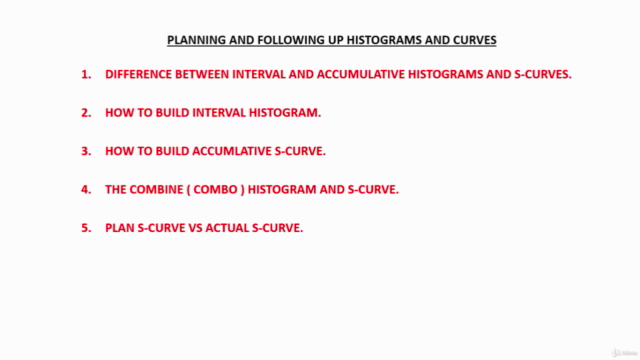
📊 Understanding Histograms and S-curves: Learn the foundational differences between interval and accumulative histograms, as well as S-curves, and how they can be used to interpret data and forecast trends.
✅ Interval Histograms:
- Discover the step-by-step process of building an interval histogram in Excel, from binning your data to visualizing it effectively.
✅ Accumulative S-curves:
- Master the technique for constructing an accumulative S-curve, which is crucial for understanding cumulative distributions.
🔁 Combining Histograms and S-curves:
- Explore the powerful combo histogram and S-curve to visualize both the distribution and cumulative aspects of your data in one chart.
🔍 Plan vs. Actual S-curve Comparison:
- Learn how to compare planed S-curves against actual performance, providing insights into project planning and execution.
Why Take This Course?
- Real-World Application: Transition from theoretical knowledge to practical skills that you can immediately apply to your work projects.
- Data Mastery: Understand complex data sets and communicate findings with clarity through engaging histograms and informative S-curves.
- Project Planning Excellence: Use your newfound skills to plan and forecast outcomes in large-scale projects with confidence.
By the end of this course, you will be able to:
- Create professional histograms and S-curves using Excel with ease.
- Analyze data sets effectively for better decision-making.
- Plan and forecast project timelines and resource allocation more accurately.
- Compare planed versus actual performance in a visual, understandable format.
Who is this course for?
This course is designed for:
- Project Managers who want to enhance their planning abilities with accurate data visualization.
- Business Analysts looking to refine their analytical techniques and present findings in a meaningful way.
- Data Scientists and Engineers seeking to improve their Excel skills for data interpretation and modeling.
Join us on this journey to become an Excel guru in histograms and S-curves, and take your planning capabilities to the next level! 🌟
Enroll now and turn your data into actionable insights with "Histograms and S-curves for Planning"! 🚀📊
Course Gallery


Loading charts...