Data Science:Hands-on Covid-19 Data Analysis & Visualization
Create 45 graphs including Choropleth maps, WordCloud, Animation, Bar graphs, scatter plots & more to visualize Covid-19
4.23 (145 reviews)

13 784
students
2 hours
content
Sep 2020
last update
$19.99
regular price
Why take this course?
🚀 Transform Your Data into Awe-Inspiring Visuals with Python & Plotly Express! 📊✨
🧠 Are you eager to craft stunning graphs and charts that capture your audience's attention? Look no further! This is the ultimate course for you! 🎉
🚀 Data Science: Hands-On Covid-19 Data Analysis & Visualization 🌐
Course Overview:
Why This Course?
What You'll Learn:
- Importing Libraries - The starting point for all your data visualization projects.
- Importing Datasets - Access and utilize real-world data sets efficiently.
- Data Cleaning - Master the art of cleaning and prepping your data for analysis.
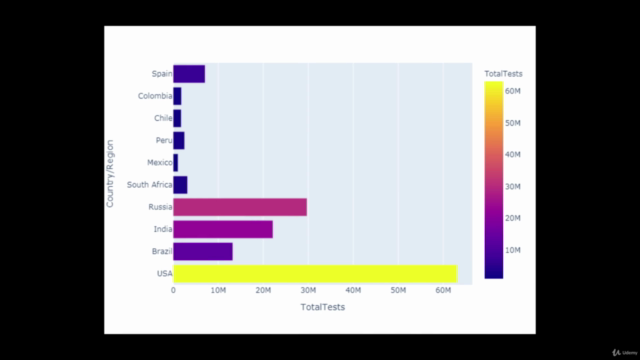
- Bar Graphs - Compare Covid infected countries in various aspects.
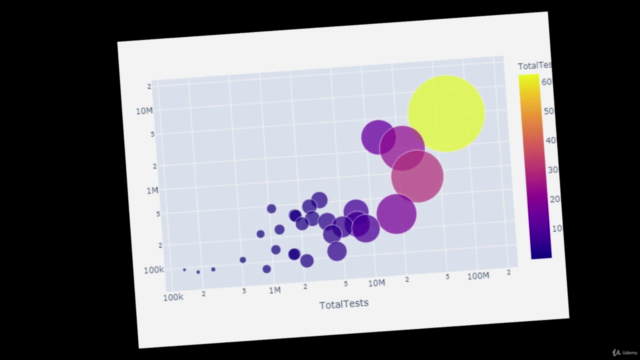
- Bubble & Scatter Plots - Visualize complex relationships within the data.
- Choropleth Maps - Map out Covid cases with color gradients to reveal geographic distributions.
- Animated Visualizations - Bring your graphs to life, showcasing trends over time.
- WordClouds - Explore the most frequently mentioned terms related to Covid deaths.
- Google Colab Integration - Work seamlessly in an online notebook environment.
Your Learning Journey:
- Engage with Interactive Coding - Write the code, see the results, and learn by doing!
- Comprehensive Guidance - Step-by-step instructions that make learning accessible and fun.
- Real-World Application - Apply your skills to a dataset that's both relevant and engaging.
- Certification & Resources - Receive a certificate of completion and access to all datasets and Colab notebooks used in the course.
Course Highlights:
- 45 Amazing Graphs - Create an array of visualizations with just one line of code each.
- 21st Century Skill Mastery - Data visualization is a hot commodity in today's tech-driven world.
- Certificate of Achievement - Showcase your new skills with a certificate from the School of Disruptive Education.
- All Necessary Datasets - Everything you need to start your data journey is provided.
- Colab Notebook Link - Continue practicing or revisit lessons with an easy-to-access notebook.
Enrollment Details:
- Priceless Knowledge - Invest in yourself for less than the cost of lunch!
- Easy Access - Start anytime, anywhere with Google Colab.
- Expert Guidance - Follow along with expertly crafted lessons and real-time examples.
🚀 Ready to embark on this visual journey? Enroll now and transform data into stories that capture the essence of your message! 📈
🎉 Happy Learning & Happy Visualizing! 🎉
Course Gallery


Loading charts...
Related Topics
3499092
udemy ID
14/09/2020
course created date
17/09/2020
course indexed date
Bot
course submited by