Data Science:Covid-19 Data Analysis Visualization Deployment

Why take this course?
🎓 Course Title: Data Science: Covid-19 Data Analysis, Visualization & Deployment
Course Headline:
A Practical Hands-On Data Science Project on Covid-19 Data Analysis, Visualization (& Deployment)
Course Description:
Dive into the world of Data Science with a focus on COVID-19 Data Analysis, Visualization, and Cloud Deployment in this comprehensive course. Designed to equip you with all the necessary skills from data understanding to deploying your analysis on cloud platforms.
📊 What You Will Learn:
- Data Analysis: Understanding and preparing your dataset for analysis.
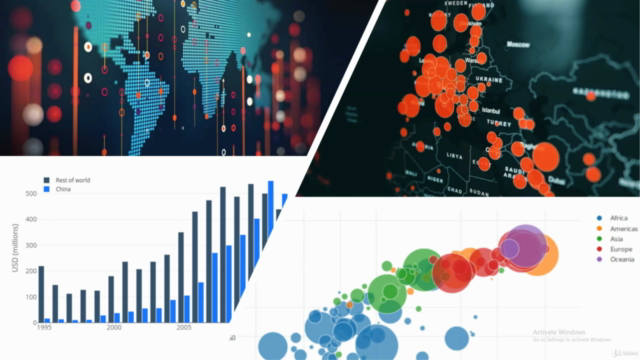
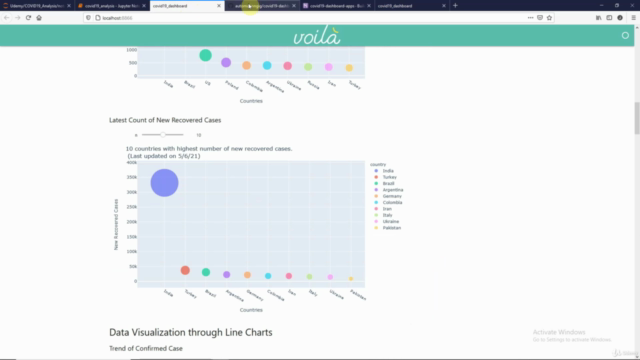
- Data Visualization with Plotly Express: Create beautiful graphs including Bubble Charts, Bar Charts, Line Plots, and interactive visualizations.
- Interactive Features: Enhance user interaction by allowing changes to data in real-time.
- Geospatial Analysis: Plot COVID-19 data on a world map for a clearer view of the pandemic's spread.
- Deployment on Cloud: Learn how to deploy your project on cloud platforms like Heroku, making your analysis accessible globally.
Course Breakdown:
- 📚 Task 1: Importing Libraries
- Install and import the necessary libraries for the course.
- 📊 Task 2: Loading the Data
- Fetch real-time data from a trusted source that's updated daily.
- 🧐 Task 3: Data Understanding
- Comprehend the structure and content of your dataset.
- 📈 Task 4: Data Preparation
- Clean, transform, and prepare data for analysis.
- 🔢 Task 5: Extracting Global Status Counts
- Aggregate the overall worldwide status of COVID-19.
- 🛠️ Task 6: Feature Engineering
- Create new features from the existing data to enrich analysis.
- 🌍 Task 7: Visualizing with Plotly Bubble Charts (Top n Countries by New Confirmed Cases)
- 📈 Task 8: Visualizing with Plotly Bubble Charts (Top n Countries by New Death Cases)
- 📈 Task 9: Visualizing with Plotly Bubble Charts (Top n Countries by New Recovered Cases)
- 📈 Task 10: Time Series Analysis of Confirmed Cases
- Trend analysis with the option to select a country from a drop-down menu.
- 📈 Task 11: Time Series Analysis of Deaths
- 🌍 Task 12: Visualizing COVID-19 Spread on World Map
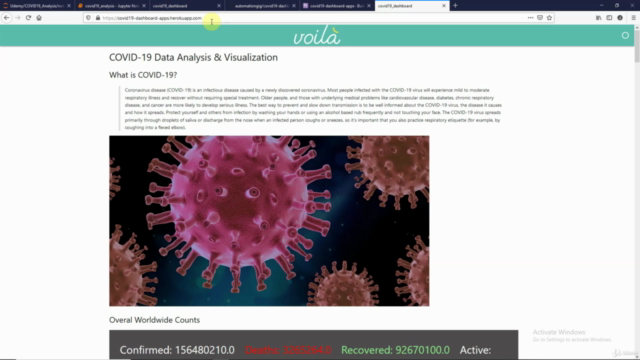
- 🗂️ Task 13: Dashboard Creation
- Compile all data analysis and visualization graphs into a COVID-19 dashboard.
- 🚀 Task 14: Introduction to Voila
- 💻 Task 15: Running Your Notebook on Voila Server
- 🛠️ Task 16: Pushing Your Project to GitHub Repository
- 🚀 Task 17: Hosting Your Project on Heroku Platform for Free
Why Take This Course?
- In-Demand Skills: Data analysis and visualization are essential skills in the modern data-driven world.
- Educational Content: Full access to Jupyter notebooks and all supporting project files upon completion.
- Certification: Receive a certificate of completion from AutomationGig.
- Flexibility: Learn at your own pace with the freedom to apply what you learn in real-time scenarios.
Ready to embark on this data science journey? ✈️ Click on the ENROLL NOW button, grab a coffee, and start mastering the most demanded skill of the 21st century from the comfort of your home or office.
[Note: This course is for educational purposes only.]
🎉 Happy Learning! 🎉
Enroll now to transform data into meaningful insights with Data Science and visualize the impact of COVID-19 on a global scale. Let's make data analysis accessible and understandable to everyone!
Course Gallery

Loading charts...