Guideline | Builder for dashboard in Power BI
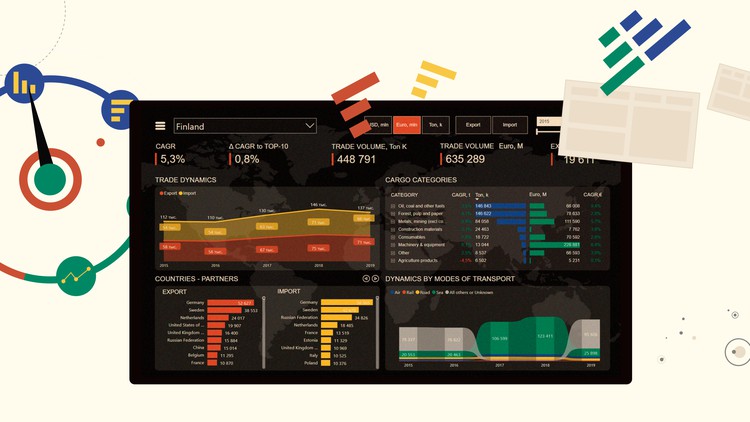
Why take this course?
Course Title: Guideline | Builder for dashboard in Power BI 🚀
Course Headline: Master Data Visualization with Power BI: Templates, Guidelines, and Report Building Techniques 📊✨
Unlock the Power of Data with Power BI!
Course Description:
Hello there, data enthusiasts and visualization virtuosos! I'm Alex Kolokolov, your guide on this transformative journey into the world of data dashboards. If you've ever felt overwhelmed by the complexities of Power BI or daunted by the task of creating a dashboard from scratch, this mini-course is your golden ticket to simplicity and efficiency.
What's Inside? 🧐✨
- 7 Chart Templates: A collection of the most sought-after visualizations to kickstart your dashboard design.
- 8 Backgrounds: A set of versatile backgrounds to quickly lay out your dashboard's foundation.
- 3 Sales Dashboard Examples: Real-world scenarios to help you understand the application and impact of a well-designed dashboard.
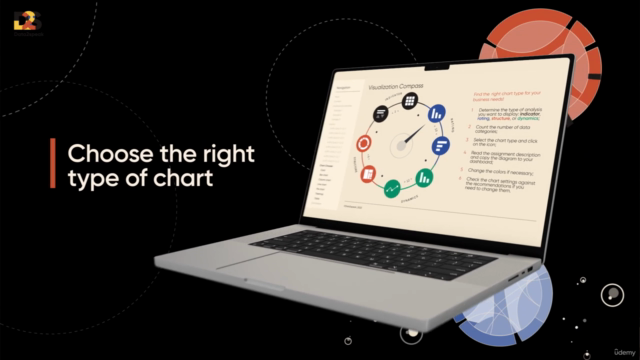
- Visualization Compass: A key to choosing the right chart for your data type, ensuring clarity and effectiveness.
Important Note: This is a DEMO version of our comprehensive product. The full version, packed with even more templates and features, is coming soon! 🛠️🔧
In This Mini-Course, You Will:
- Understand Dashboard Design Principles: Learn the golden rules that make a dashboard not just good, but great.
- Improve User Experience: Create interfaces that are user-friendly and intuitive for anyone who interacts with your dashboards.
- Build Your Own Dashboard in 30 Minutes: Follow our step-by-step guide to craft a customized dashboard from the ground up, quickly and effectively.
- Learn Data Visualization Techniques: Discover how to use different chart types to present your data clearly and powerfully.
Who Is This For?
This course is perfect for:
- Beginners who are new to Power BI and want to learn the ropes quickly.
- Seasoned analysts looking to streamline their dashboard creation process.
- Designers seeking to enhance their data visualization skills without the design struggle.
- Anyone who wants to reduce the time spent on setting up, customizing, and aligning charts.
Why Follow Our Guideline?
Creating a high-quality dashboard can be a daunting task if you're not familiar with the tools or design principles. It involves:
- Choosing the Right Diagram: No more guessing which chart type suits your data best.
- Setting Up Charts: With colors, labels, and fonts all aligned to present your data in the most impactful way.
- Aligning Dashboard Elements: Every element where it needs to be, effortlessly, every time.
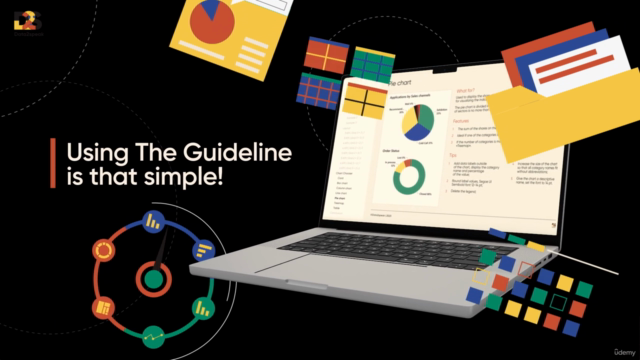
Our guideline simplifies this process, allowing you to create attractive and functional dashboards that are not only visually appealing but also highly effective for analyzing data. 🎨💡
Join Us on This Data Adventure!
By following the guidelines provided in our mini-course, you'll be well on your way to becoming a Power BI dashboard maestro. Say goodbye to the frustration and time consumption associated with dashboard creation. With our templates and clear instructions, you'll be able to focus on what truly matters—making data-driven decisions that can change the game for your business or project.
Enroll now and take the first step towards becoming a Power BI pro! 🌟🚀
Course Gallery

Loading charts...