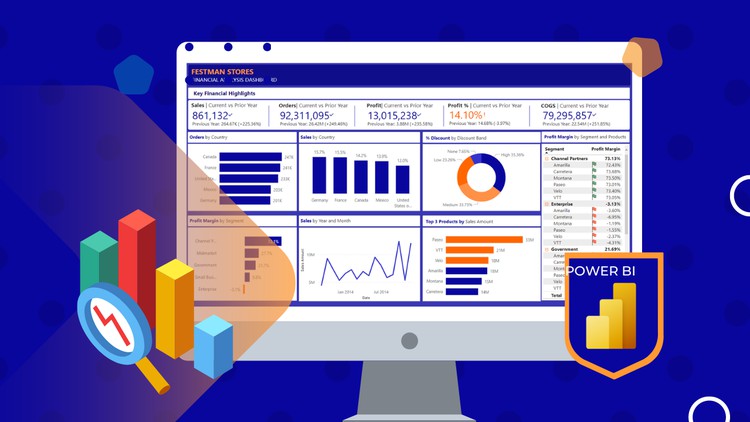
Financial Analytics with Power BI

Why take this course?
🚀 Course Title: Financial Analytics with Power BI 📊
Headline: Design Interactive Financial Analysis Dashboards with Microsoft Power BI ✨
👩💻 Course Description: Are you ready to embark on a journey into the realm of data analytics? If you're considering a career in Data, or looking to enhance your skillset, this is the perfect course for you! 🌟
In this comprehensive online course offered by FestMan Learning Hub, you will dive deep into the world of financial analytics using Microsoft Power BI. This platform is a game-changer for data analysis and visualization, and mastering it can open up a plethora of opportunities in the field of finance and beyond.
Throughout this course, you'll:
- Connect to Data: Learn how to efficiently connect to various financial data sources.
- Data Cleaning & Transformation: Gain expertise in cleaning and preparing your data for analysis.
- Advanced Data Modeling and DAX: Discover the power of Data Analysis Expressions (DAX) to manipulate and analyze your data.
- Time Intelligence Functions: Master time-based calculations, such as Year Over Year change, to make informed financial decisions.
- Interactive Visualization: Create dynamic and interactive visualizations that bring your financial analysis to life.
- Reporting Development: Develop professional financial reports with a focus on interactivity and user engagement.
By the end of this guided project, you'll be not just familiar with Power BI, but extremely comfortable building your own reports and dashboards. This skill set is highly sought after in the industry! 💼
Key Learning Outcomes:
- Data Cleaning and Modelling: Learn to prepare your data for insightful analysis.
- Data Analysis with DAX: Understand and apply DAX to perform complex calculations.
- Time Intelligence: Utilize Power BI's Time intelligence functions for time-based financial analysis.
- Conditional Formatting: Apply conditional formatting to highlight key metrics and trends.
- Data Visualization: Learn best practices for visualizing your data effectively.
- Reporting Development: Develop interactive, user-friendly financial dashboards.
📢 Student Testimonials:
"All concepts are carefully explained and illustrated. I enjoy every bit of the training. Thank you to all the FestMan team. Brilliant Course." - Folorunso Adebare Lala 🚀
"The course is easy to understand, and the instructor explains the content quite well. The content is plentiful and great in a well-put project. This course has significantly boosted my confidence in Power BI." - Octavio 🌱
Why Choose FestMan Learning Hub for Financial Analytics with Power BI?
- Expert Instructors: Learn from industry experts who bring real-world experience to the classroom.
- Hands-On Projects: Gain practical experience by working on a real project that you can add to your portfolio.
- Interactive Learning: Engage with the material through interactive exercises and discussions.
- Community Support: Join a community of like-minded learners who support each other's growth and learning journey.
- Flexible Learning: Learn at your own pace, with materials accessible 24/7 to fit your busy schedule.
📆 Enroll now and take the first step towards a career in financial analytics with Power BI! Let FestMan Learning Hub be your guide on this exciting learning adventure. 🚀✨
Loading charts...