Graphs in R - Data Visualization with R Programming Language

Why take this course?
📊 Graphs in R - Mastering Data Visualization with R Programming Language 🚀
Course Headline: Unlock the full potential of data visualization with our comprehensive course on creating convincing graphs in R using ggplot2, lattice, plotrix & base functionalities.
Course Description: Are you ready to transform your data into compelling narratives through the power of R graphics? Our "Graphs in R" online course is designed for individuals who are eager to:
- 🌟 Communicate data clearly and effectively with insightful graphs.
- 🔍 Understand complex datasets and convey their essence in an accessible manner.
- 🤝 Make your data relatable to diverse audiences, regardless of their technical expertise.
- ⚙️ Expand your graphics toolbox with a versatile set of tools.
- ✨ Master advanced formatting techniques to elevate the presentation of your visualizations.
Why This Course? If you've ever pondered over how to present your data in a way that is both insightful and visually appealing, this course is the answer to your quest. R-Tutorials is here to guide you through the intricacies of data visualization with R, ensuring that your data storytelling is as powerful as it can be.
Course Highlights:
- Learn at Your Own Pace: With a curriculum designed for hands-on learning, each section includes exercises and a downloadable code PDF to practice what you've learned directly on your own datasets.
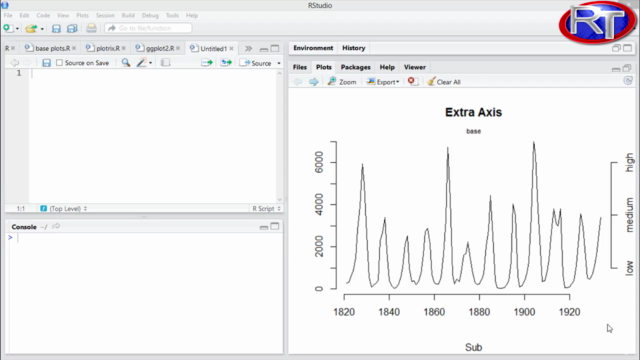
- Comprehensive Coverage: Begin with the foundational aspects of R base graphics before diving into the advanced capabilities of packages like ggplot2, lattice, and plotrix.
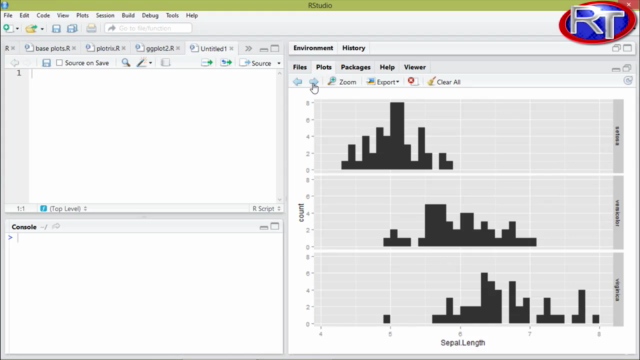
- In-Depth Tutorials: Gain an in-depth understanding of each package, with a special focus on ggplot2, which is widely regarded as the most powerful graphics device within R.
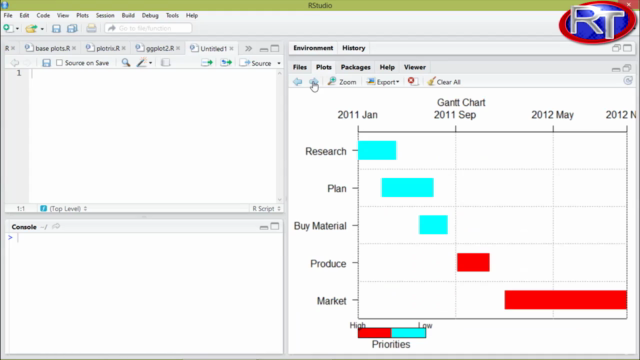
- Versatile Skills: Develop skills that will enable you to create a wide variety of visualizations, including scatter plots, histograms, line graphs, and more.
- Real-World Applications: Learn how to apply these techniques to real-world datasets and scenarios.
What You Will Learn:
- The essential base parameters for formatting and manipulating basic R graphs.
- How to work with common types of R base graphics.
- The power of the
plotrixpackage for extending your visualization capabilities. - An in-depth tutorial on mastering ggplot2, one of R's most popular data visualization packages.
- The strengths of
latticefor producing sophisticated multi-plot displays.
Who Should Take This Course: Whether you're a student, researcher, analyst, or business professional, this course is designed to enhance your ability to communicate through data visualizations in R. With the skills you learn here, you will have an extremely powerful toolbox to excel in your career and studies.
Ready to Dive In? Don't wait any longer to elevate your data visualization capabilities with R. Join us at R-Tutorials and transform how you present and interpret data. 🎓
--
Instructor: Martin Your guide to becoming an expert in data visualization with R.
Course Gallery
Loading charts...