Complete Visualization: Graphing Data with yEd and Visio

Why take this course?
🌟 Complete Visualization: Data Graphs, Diagrams yEd & Visio 5 Hours - For Non-Programmers! 🌟
Course Headline:
Graph Theory. Data Diagram and Network Analysis with GML Visualisation, yEd and MS Visio 📊🔍
Course Description:
Are you a student, researcher, or data scientist looking to delve into the world of graph and network analysis for your research, reporting, or publication needs? Look no further! This comprehensive video course is tailored to help you visualize and analyze complex data without needing to dive into programming.
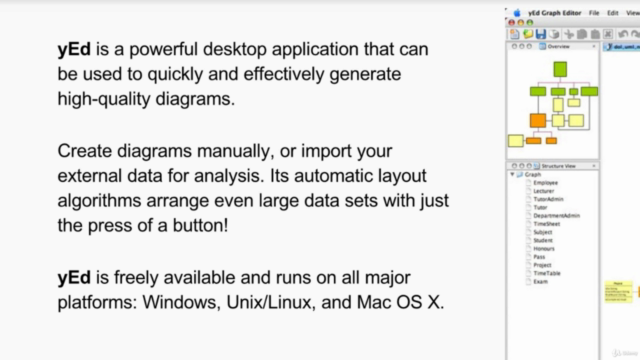
With yEd, a robust desktop application, you can swiftly generate high-quality diagrams either by hand or by importing your external data for detailed analysis. Its sophisticated layout algorithms make short work of organizing even the largest datasets with just a click. The best part? yEd is available for free and runs across Windows, Unix/Linux, and Mac OS X!
In this course, you'll master yEd by learning:
- Creating graphs: Learn how to build graphs that can represent any network or graph data.
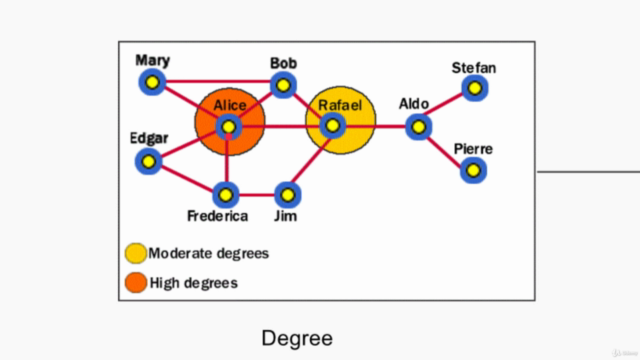
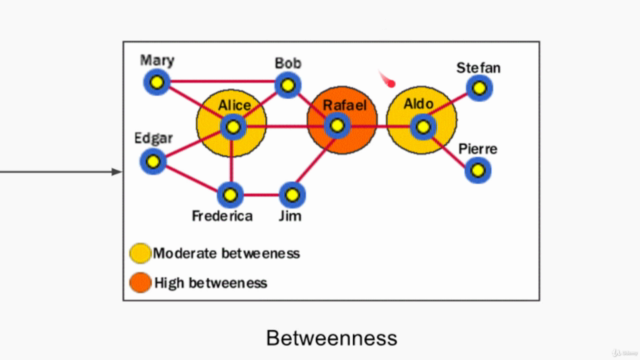
- Graph analysis: Understand key concepts like Centrality, Clustering, and Graph Geometric Transformations.
- Exporting diagrams: Get proficient in exporting your work as PDFs and high-resolution images, perfect for presentations and publications.
- Using GML files: Dive into Graph Manipulation Language (GML) to edit and manipulate your graphs through text files.
MS Visio is an innovative tool that extends the capabilities of Microsoft 365 within Teams and Power Platform products, allowing for seamless data-connected visualizations. In this course, you'll progress from understanding the basics to exploring advanced features such as:
- Diagram manipulation: Add, edit, and organize shapes and text in your diagrams.
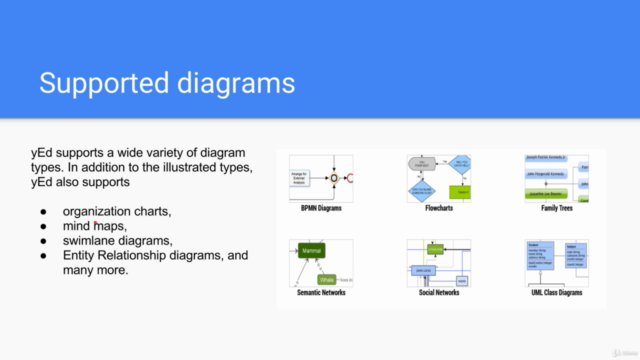
- Creating various diagram types: From flowcharts and floor plans to org charts, Visio offers versatile options for all your visual needs.
- Documenting processes: Learn how to effectively document business processes within Visio.
- Linking with data sources: Connect Visio with external data sources to enhance your diagrams with dynamic data.
- Collaboration: Collaborate in real-time with other users, making teamwork a breeze.
- Custom shapes creation: Create your own custom shapes to add uniqueness to your diagrams.
- Efficiency tips and tricks: Discover time-saving methods that will streamline your workflow.
What You'll Learn:
This course is designed for hands-on learning, ensuring you gain practical experience with both yEd and MS Visio. By the end of this program, you'll be adept at creating professional visualizations without the need for scientific programming background.
Key Takeaways:
- Practical Skills: Learn through real-world applications and tasks that will immediately enhance your ability to visualize data.
- Non-Programmer Focus: This course is specifically tailored for individuals who are not programmers but require powerful tools for data visualization and analysis.
- Comprehensive Coverage: From the basics to advanced techniques, this course covers the entire spectrum of functionalities in both yEd and MS Visio.
- Reporting Ready: Equip yourself with the skills to create impactful visualizations that are publication-ready.
Enroll now to embark on your journey towards becoming a data visualization expert! With this course, you'll be well-equipped to handle graph theory and network analysis for any project or presentation. 🚀📈
Note: This course emphasizes the visualization aspects of graph theory, which are essential for reporting purposes. It is designed as an entry-level course for non-programmers, focusing on the practical applications of yEd and MS Visio in visualizing and analyzing data graphs.
Course Gallery
Loading charts...