Grafana Master Course - Time Series Data Visualization

Why take this course?
📊 Grafana Master Course - Time Series Data Visualization 🚀
Course Headline: Query, Visualize, Alert on and understand your Metrics. Create, Explore and Share Dashboards using Grafana.
Dive into the world of data visualization with our comprehensive Grafana Master Course. Designed for administrators, DevOps engineers, developers, and anyone looking to master time series data analytics, this course will equip you with the skills needed to leverage Grafana's full potential.
Course Highlights:
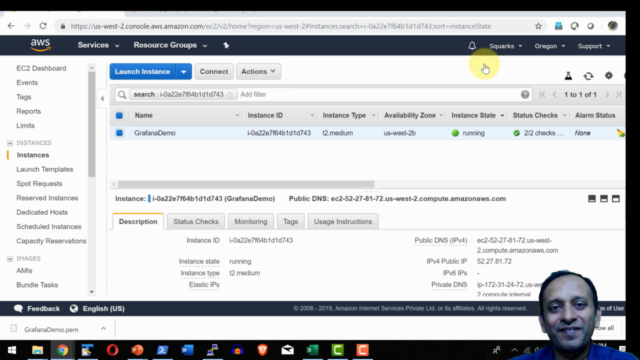
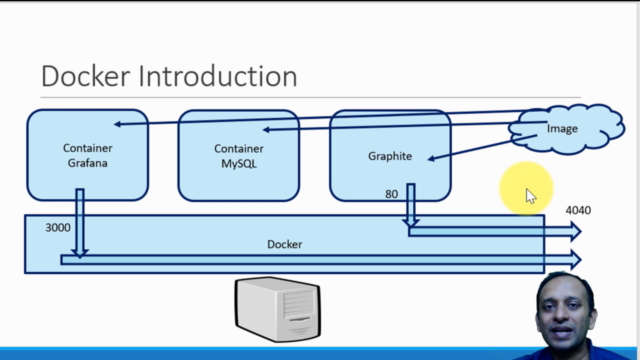
🔹 Installation Flexibility: Learn how to install Grafana on various platforms including Linux, Windows, and using Docker. This ensures that whether you're managing a server room or working locally, you can set up Grafana without hassle.
🔹 Data Sources Mastery: Understand how to configure and manage a wide array of data sources such as Graphite, Prometheus, InfluxDB, Elasticsearch, AWS Cloudwatch, MySQL, OpenTSDB, and more. Learn best practices for each to ensure your data is accurate and accessible.
🔹 Dashboard Architecture: Delve into the anatomy of Grafana dashboards, panels, and the elements that make them powerful. From creating basic dashboards to mastering complex structures, you'll learn it all.
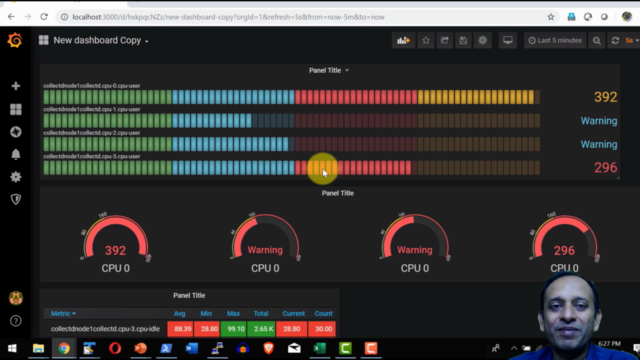
🔹 Panel Diversity: Explore different types of panels including Graph, Singlestat, Table, Heatmap, and Alert List. Each type serves a unique purpose and learning how to implement them effectively will make your data come alive.
🔹 Advanced Features & Functionalities: Discover advanced topics such as variables, annotations, folders, playlists, search, sharing options, time range customization, exporting/importing dashboards, scripted dashboards, and dashboard version history. These features will elevate your Grafana experience from beginner to pro.
🔹 Data Visualization with Intuition: Learn how to collaborate on IoT, infrastructure, and DevOps data, and visualize it using Grafana's intuitive user interface. This course will teach you how to turn complex datasets into clear, actionable visualizations.
🔹 Alert Settings & Notifications: Understand the critical role of alerts in monitoring systems and learn how to configure alert settings and notifications within Grafana. Stay informed and responsive to your metrics with this powerful feature.
Who is this course for?
- System Administrators who want to monitor their infrastructure more efficiently.
- DevOps Engineers looking to implement Grafana as part of their CI/CD pipeline.
- Developers aiming to visualize application metrics and performance indicators in real-time.
- Data Analysts seeking to create interactive dashboards for data exploration.
- Anyone interested in understanding and utilizing time series data effectively.
By the end of this course, you'll not only be able to create and share dashboards but also understand how to query, visualize, and alert on your metrics with confidence. Whether you're monitoring IoT devices, tracking server performance, or analyzing business KPIs, Grafana is an indispensable tool in today's data-driven world.
🎓 Embark on your journey to mastering Grafana and turn your time series data into actionable insights today! 🎓
Course Gallery


Loading charts...