Getting started with Sap Analytics Cloud

Why take this course?
🎓 Getting Started with Sap Analytics Cloud - Your Journey to Mastering Data Analytics Begins Here!
🚀 Course Overview: Welcome to the comprehensive guide to mastering SAP Analytics Cloud (SAC) – your gateway to transforming data into strategic insights. This course is tailored for beginners who are eager to learn and experts looking to refine their skills in data analysis, reporting, and decision support. With over 40 lectures and 4.5 hours of engaging content, this is the perfect blend of theory and practical application to build your portfolio in SAC.
📚 What You'll Learn:
-
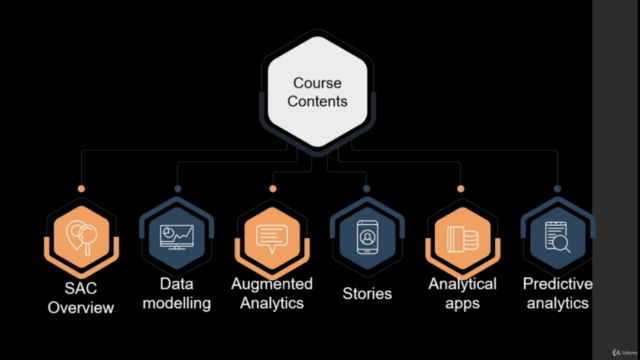
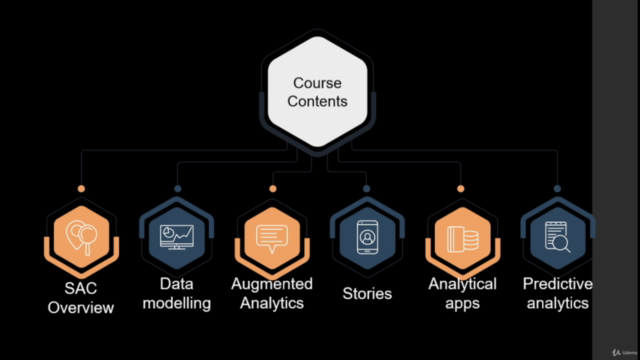
Introduction to SAP Analytics Cloud: We kick off by exploring the core concepts of SAP Analytics Cloud, its transformative role in data analytics, and how it turns raw data into meaningful insights.
-
Data Sources & Modeling: Learn to connect various data sources, including on-premise and cloud-based systems, and understand the different data modeling options available within SAC.
-
Dashboard & Report Design: Gain hands-on experience in creating visually compelling dashboards and reports that are both interactive and informative, driving actionable outcomes.
-
Financial Planning: Dive into designing dynamic planning models and budgets to enable your organization to make informed financial decisions.
-
Advanced Analytics: Explore the advanced analytics features such as predictive forecasting and data discovery to identify trends, uncover hidden patterns, and make accurate predictions based on historical data.
-
Data Visualization & Storytelling: Master best practices in data visualization, storytelling, and collaboration to effectively communicate complex insights and drive better business decisions.
-
Collaboration & Sharing: Discover how to collaborate with team members, ensuring seamless knowledge sharing and decision-making across your organization.
🔍 Practical Application: Throughout the course, we focus on practical examples to help you build models, stories, and analytical applications using SAP Analytics Cloud. You'll also get hands-on experience with Predictive Data Analytics, learning how to transform data sets into useful insights for better decision-making.
🧠 Key Topics Covered:
- Importing, cleaning, and modifying data sources for SAP Analytics Cloud.
- Building models using CSV files and SQL queries from Google BigQuery.
- Creating stories and analytical applications from scratch.
- Exporting views as PDF or PPTX.
- Using JavaScript to create variables and functions.
- Designing interactive elements between charts in stories and applications.
- Developing Classification, Regression, and Time Series models.
- Interpreting metrics for each model type.
- Applying trained models to unseen datasets to make predictions.
🚀 Who Should Take This Course? This course is ideal for:
- Business Analysts seeking to enhance their data analysis skills.
- Data Scientists aiming to understand the application of analytics in a business context.
- Aspiring analytics professionals looking to build a career in data analytics.
💡 Join the Community of Data Experts: Embark on an exciting journey into the world of SAP Analytics Cloud. This course will not only advance your career but also increase your knowledge in a fun and practical way. With lifetime access to over 40+ lectures plus corresponding datasets, you'll be well-equipped to harness the full potential of SAC for strategic decision-making.
📝 Disclaimer: SAP Analytics Cloud® is a registered trademark of SAP®. This course is for educational purposes only and is not affiliated with or endorsed by SAP.
🤝 Take the Next Step: Ready to dive into the world of Sap Analytics Cloud? Enroll now and unlock the doors to data-driven success! 🚀
Remember, this is your pathway to becoming proficient in one of the most powerful tools for data analytics. With each lecture, you'll build upon your skills, gaining confidence and expertise in using SAP Analytics Cloud to make informed business decisions. Don't wait – start your journey today! 🌟
Course Gallery


Loading charts...