Getting Started with Microsoft Power BI (Updated 2023)

Why take this course?
🌟 Getting Started with Microsoft Power BI (Updated 2023) 🌟
Your Journey to Mastering Data Analytics Begins Here!
If you're on the lookout for an engaging and comprehensive online course that will teach you the ins and outs of Microsoft Power BI, or if you aim to prep for the DA-100 exam, then this is the perfect place to start. 🚀
Course Overview:
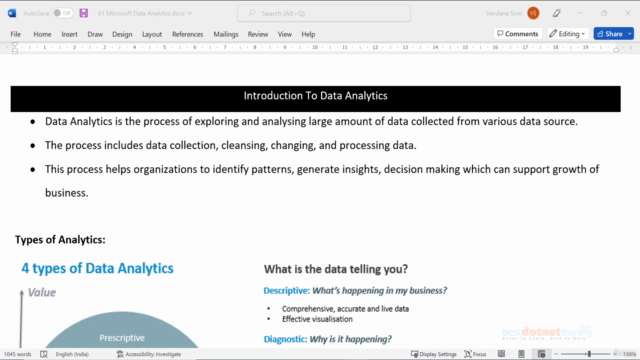
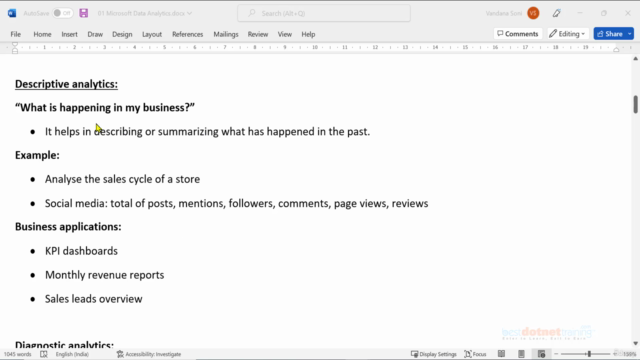
In today's data-driven world, the ability to transform, analyze, and visualize data is invaluable. Microsoft Power BI Desktop stands out as one of the hottest analytical software tools in the market. This course is designed to guide you through the process of leveraging Power BI's robust features to extract meaningful insights from your data.
Why Learn Power BI? 🤔
Power BI is a game-changer in the realm of Business Intelligence (BI). Here's why:
-
Easy to Use: Power BI's intuitive design allows you to create stunning visualizations with just a drag and drop interface, offering a plethora of chart types to suit your analysis needs.
-
Easy to Share: The platform's collaborative nature enables you to share reports seamlessly across various platforms.
-
Easy to Understand: With natural language queries, anyone can interact with the data and create reports that make sense.
-
Powerful Tool: Power BI builds on the strength of Power Query for data modeling, making it a powerful tool for both data visualization and analysis.
-
Universal Compatibility: Access your dashboards anywhere, anytime—Power BI works across all devices and platforms.
Career Opportunities with Power BI 💼
The demand for Power BI experts is soaring, and the rewards are impressive! Professionals in this field can expect to earn an average of $117,000 annually. Whether you aspire to be a Data Analyst or a Power BI Developer, the opportunities are endless.
What You’ll Learn / Course Objective: 🎓
This course is packed with practical learning that will empower you to:
-
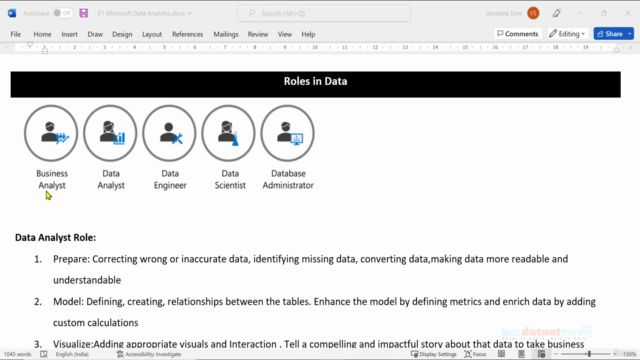
Identify Different Roles in the Data Space
-
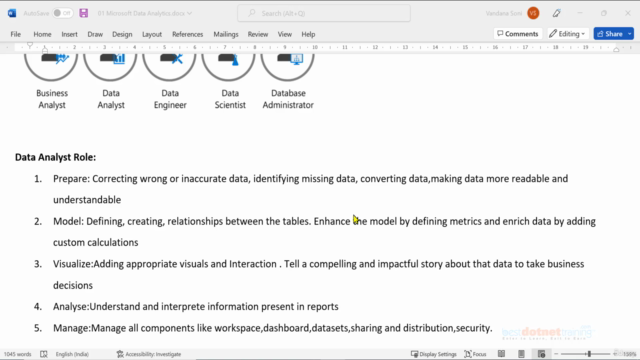
Identify Tasks Performed by a Data Analyst
-
Describe the Power BI Landscape of Products and Services
-
Understand Different Connection Methods and Their Performance Implications
-
Apply Data Shape Transformations
-
Understand the Basics of Data Modeling
-
Define Relationships and Their Cardinality
-
Implement Dimensions and Hierarchies
-
Create Histograms and Rankings
-
Understand DAX and Use DAX for Simple Formulas and Expressions
-
Work with Time Intelligence and Key Performance Indicators (KPIs)
-
Select and Add Appropriate Visualization Types
-
Add Basic Report Navigation and Interactions
-
Create and Configure a Data Source and Dataset
By the end of this course, you will have a solid understanding of how to use Power BI to transform raw data into actionable insights through compelling visuals and interactive reports. Whether you're an aspiring analyst or looking to enhance your career with new skills, this course will set you on the path to success in the world of Business Intelligence.
Enroll now and step into the future of data analytics with Microsoft Power BI! 💫
Note: This course is designed for beginners and intermediate users familiar with Excel and basic data concepts. No prior experience with Power BI is required. Let's embark on this journey to master Power BI together! 🚀💪
Course Gallery


Loading charts...