Geospatial Data Science with Python: Data Visualization
Why take this course?
🎉 Master Geospatial Data Science with Python: From Static Tabular Visualizations to Interactive Geospatial Mapping 🎉
Course Title: Geospatial Data Science with Python: Data Visualization](# "Clickable Course Title for more info")
Dive into the world of data visualization and geospatial analysis with our comprehensive online course tailored for data scientists, analysts, and GIS enthusiasts! This course is designed to equip you with the skills to create compelling tabular and geospatial visualizations using a suite of powerful Python packages within the versatile Jupyter Notebook environment.
Why Take This Course? 🚀
- Hands-On Learning: Gain practical experience by working on real-world datasets and projects.
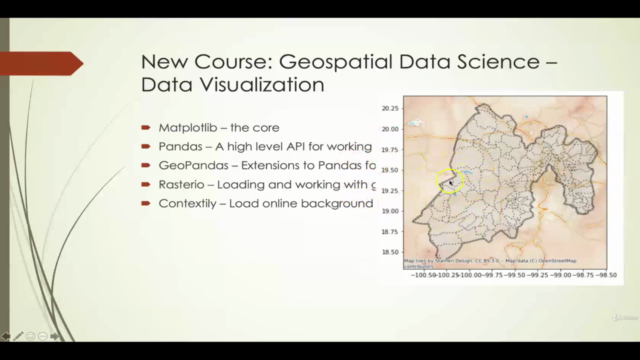
- Powerful Toolkit Mastery: Learn to use Matplotlib, Pandas, GeoPandas, Rasterio, Contextily, Seaborn, Plotly, and Bokeh with confidence.
- Geospatial Analysis Made Easy: Discover how to perform geospatial analysis alongside your visualization workflows.
- Jupyter Notebook Proficiency: Utilize the full potential of Jupyter Notebooks for data analysis and reporting.
- Interactive & Static Visualizations: Understand when and how to use static vs. interactive visualizations for maximum impact.
Course Highlights: 📊✨
**- Static Visualization with Matplotlib:
- Learn the foundational aspects of Matplotlib for creating high-quality static plots.
- Master the art of customizing plots with labels, titles, and annotations.
**- Geospatial Data Analysis with Pandas, GeoPandas & Rasterio:
- Explore geographic data with GeoPandas and understand spatial operations like clipping and buffering.
- Map raster datasets using Rasterio and analyze them in the context of your project.
**- Enhanced Mapping with Contextily & Seaborn:
- Integrate Contextily for easy-to-create, stylish maps.
- Enhance your geospatial visualizations with Seaborn's aesthetically pleasing themes and color palettes.
**- Dynamic Visualization Techniques with Plotly & Bokeh:
- Create interactive plots that respond to user input (mouse movements, clicks, etc.).
- Learn how to incorporate widgets, dropdowns, sliders, and more in your visualizations.
Course Structure: 📚
-
Introduction to Python Data Visualization Libraries:
- An overview of the ecosystem of data visualization tools available in Python.
-
Matplotlib Mastery:
- Understanding Matplotlib figures, axes, and subplots.
- Tips and tricks for crafting compelling static visualizations.
-
Geospatial Data with Pandas & GeoPandas:
- Handling geospatial data with Pandas DataFrames and GeoDataFrames.
- Performing spatial analysis operations like nearest neighbors, buffer zones, and spatial joins.
-
Exploring Raster Data with Rasterio & Contextily:
- Working with raster datasets to analyze geographic information system (GIS) imagery.
- Creating web-ready maps with Contextily and embedding them in Jupyter Notebooks.
-
Advanced Visualization Techniques with Seaborn, Plotly & Bokeh:
- Incorporating Seaborn for data visualization with a statistical perspective.
- Developing interactive dashboards using Plotly and Bokeh to tell your data's story in a dynamic way.
Who This Course Is For: 👥
- Data Scientists who want to enhance their data visualization skills.
- Analysts looking to incorporate geospatial analysis into their toolkit.
- GIS professionals aiming to expand their skillset with Python.
- Any individual or team interested in integrating advanced data visualizations into their projects.
Join Us & Transform Your Data into Stories! 📈
By the end of this course, you'll be equipped with a robust skill set to tackle complex data visualization tasks and bring your geospatial analysis to life. Whether you're an expert or just starting out, this course will guide you through each concept and ensure you're ready to take on any data challenge that comes your way.
🎓 Enroll now and embark on your journey to becoming a Geospatial Data Science maestro with Python! 🎓
Course Gallery
Loading charts...