Geospatial Analysis With Python (Vector Data)

Why take this course?
🚀 Course Title: Geospatial Analysis With Python (Vector Data) 🌐
Unlock the World of Geospatial Analysis with Python!
🎓 Course Headline: Master GIS with Python! 🍏
Course Description:
Welcome to the "Geospatial Analysis With Python (Vector Data)" course, your gateway into the fascinating world of Geographic Information Systems (GIS) through the power of Python. This beginner-friendly course is designed for individuals eager to explore and analyze geospatial data using Python's robust libraries and tools.
With a focus on vector data analysis, you'll dive into the realm of geospatial data handling, visualization, and manipulation using libraries like geopandas, matplotlib, shapely, and Fiona. Although you might be familiar with GIS software, this course will introduce you to a dynamic and versatile approach to GIS analysis using Python.
🌱 What You'll Learn:
-
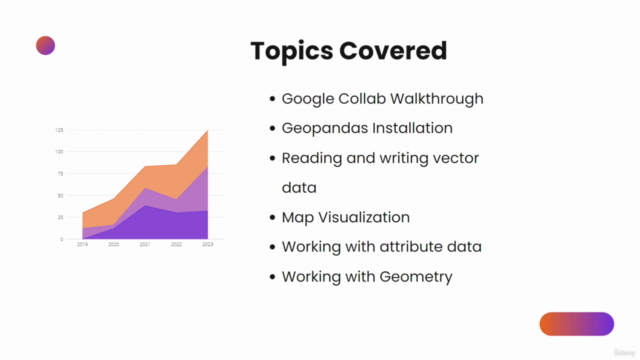
Introduction to Geospatial Data and geopandas
- Understanding the fundamentals of geospatial data structures.
- Getting acquainted with the
geopandaslibrary and its capabilities.
-
Hands-on Google Colab
- Learning to leverage Google Colab for interactive and collaborative data analysis.
-
Geopandas Installation
- Setting up your Python environment to work with geospatial data.
-
Reading Vector Data Using Geopandas
- Importing and working with vector datasets.
-
Reading Meta Data Using Geopandas
- Understanding the metadata that accompanies your spatial datasets.
-
Map Visualization using geopandas and matplotlib
- Creating static, interactive, and even dynamic visualizations of your geospatial data.
-
Writing Data
- Exporting and saving your processed geospatial data for further use or analysis.
-
Working with attribute data in python geopandas
- Manipulating and analyzing the attributes associated with geospatial features.
-
Working with geometry in python geopandas
- Performing spatial operations and calculations using
shapelywithingeopandas.
- Performing spatial operations and calculations using
-
Web Map In Python Using Fiona
- Building web-based maps and integrating them into your Python applications.
Dive Deeper into Geospatial Analysis with Python:
Geopandas:
🗺️ GeoPandas: Your Powerhouse for Geospatial Data in Python!
GeoPandas is an open-source project that simplifies the process of working with geospatial data in Python. It extends the versatile pandas library, enabling you to perform spatial operations on geometric types seamlessly. Under the hood, shapely powers the geometric computations, while Fiona handles file access and data I/O tasks. With matplotlib for plotting capabilities, GeoPandas becomes a comprehensive solution for your GIS needs in Python.
Matplotlib:
📊 Matplotlib: Elevate Your Visualizations!
Matplotlib is a robust plotting library that integrates effortlessly with Python and its NumPy extension, allowing for the creation of publication-quality graphics. This versatile library supports various GUI toolkits, making it an ideal choice for embedding plots into your applications or for standalone data visualization.
Embark on your journey to becoming a proficient geospatial analyst with Python by enrolling in this course today! 🌍➡️💻
Course Gallery


Loading charts...