Free for people with disabilities, under adults supervision
Power BI Training, Disabilities, Data Visualization Techniques, Data Import and Transformation, Creating Reports
322
students
1 hour
content
Jul 2025
last update
FREE
regular price
What you will learn
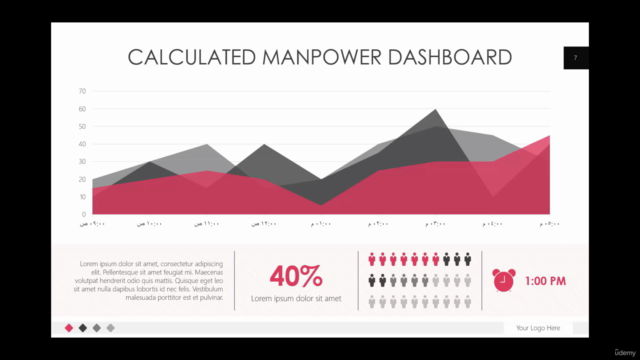
Understanding how to create effective visual representations of data using charts, graphs, and dashboards.
Learning best practices for presenting data clearly and understandably.
Instruction on how to import data from various sources (like Excel, databases, or online services) into Power BI.
Techniques for cleaning and transforming data to ensure accuracy and usability.
Course Gallery
Loading charts...
6700397
udemy ID
02/07/2025
course created date
06/07/2025
course indexed date
Bot
course submited by