Forecasting Stock Market with ARIMA Model & Time Series

Why take this course?
📈 Forecasting Stock Market with ARIMA Model & Time Series - Your Journey to Predictive Analytics Begins Here!
Course Overview:
Welcome to the "Forecasting Stock Market with ARIMA Model & Time Series" course! This project-based curriculum is designed to equip you with the skills to perform intricate stock market analysis, forecast future stock prices using advanced time series models like ARIMA (Autoregressive Integrated Moving Average), and visualize data trends effectively.
What You Will Learn:
Section 1: Introduction to Stock Market Forecasting
- Basic Fundamentals: Understand the factors that affect forecasting accuracy and explore various forecasting models.
- Mathematics of ARIMA: Learn the underlying math behind the ARIMA model and how to interpret its results with a comprehensive case study.
Section 2: Factors Impacting the Stock Market
- Internal and External Factors: Analyze market sentiment, earning reports, interest rates, and other influential elements on stock market behavior.
Section 3: Setting Up for Success
- Google Colab Setup: Master the use of Google Colab as your Integrated Development Environment (IDE) for this course.
- Data Acquisition: Discover how to find and download stock market datasets from platforms like Kaggle.
Section 4: Diving into the Project
- Dataset Preparation: Learn to clean your data, removing missing and duplicate values to ensure accurate analysis.
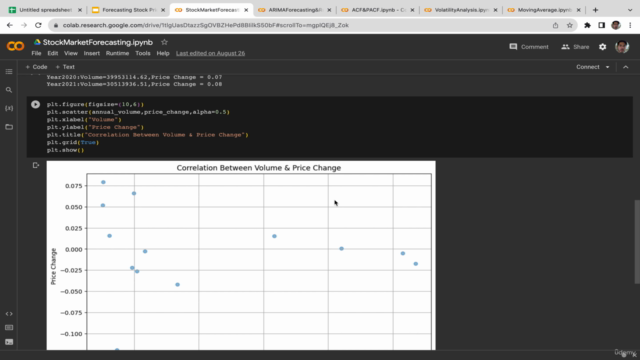
- Data Exploration: Analyze average highest and lowest stock prices per year, average volume, and explore correlations between volume and price changes.
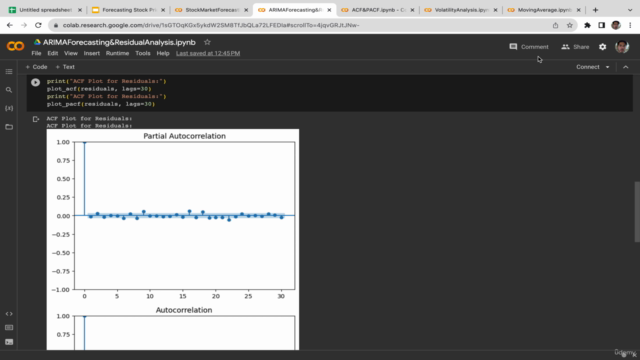
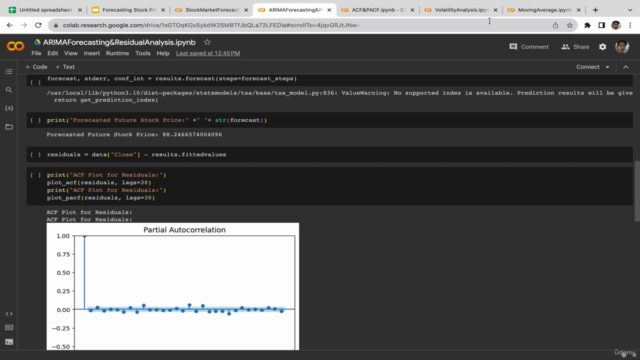
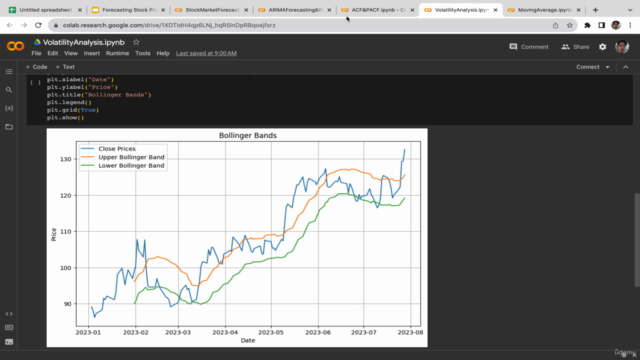
- Time Series Analysis: Calculate 100 days moving averages and visualize volatility, perform autocorrelation function (ACF) and partial autocorrelation function (PACF), and delve into forecasting using the ARIMA model.
Section 5: Evaluating Your Model
- Residual Analysis: Understand the importance of checking your model's residuals for any patterns.
- Model Performance Metrics: Learn to evaluate your forecasting model's performance by calculating Mean Absolute Error (MAE), Mean Squared Error (MSE), and Root Mean Squared Error (RMSE).
Why Forecast the Stock Market?
The stock market has been a vehicle for investment for over a century, and with the advent of big data technology, we can leverage historical data to predict future trends. While no forecast is ever 100% accurate, understanding patterns and using them to inform decision-making is invaluable. The goal here is not to predict with certainty but to make data-driven decisions that increase the likelihood of a favorable outcome.
Course Highlights:
- Comprehensive Guide: A step-by-step, hands-on approach to mastering ARIMA and Time Series analysis for stock market forecasting.
- Real-World Application: Learn by doing with practical datasets and real-world case studies.
- State-of-the-Art Tools: Utilize Python along with libraries like Pandas, Numpy, and Matplotlib to perform complex calculations and data visualization.
- Metric Mastery: Gain a deep understanding of evaluation metrics that are crucial for assessing the performance of your forecasting models.
Who Is This Course For?
This course is ideal for:
- Aspiring Data Scientists and Analysts looking to specialize in financial markets.
- Financial Professionals seeking to enhance their predictive analytics skills.
- Students with an interest in data science applications within finance.
- Anyone interested in understanding stock market movements through the lens of statistical modeling and machine learning.
Embark on your journey to becoming a proficient forecaster and analyst in the dynamic world of financial markets! Enroll now and unlock the power of predictive analytics with our "Forecasting Stock Market with ARIMA Model & Time Series" course. 🚀📊
Ready to Forecast? Enroll Today and Take Your First Step Towards Predictive Analytics Mastery!
Course Gallery


Loading charts...